Details
-
Type:
 Support
-
Status: Closed (View Workflow)
-
Priority:
 Major
Major
-
Resolution: Done
-
Labels:None
Description
From: KA Atkins <kelly.atkins@bristol.ac.uk>
Reply-To: "kelly.atkins@bristol.ac.uk" <kelly.atkins@bristol.ac.uk>
Date: Tuesday, April 21, 2015 at 7:33 AM
To: "Norris, David" <dcnorris@uncc.edu>, "Loraine, Ann" <Ann.Loraine@uncc.edu>
Subject: Question regarding Depth Graph feature in IGB
Hi,
I am wondering if you can help me. I am a new user to IGB and am finding the programme very useful in visualising my recent sequencing data. I have a rather menial question but cannot find the answer in the literature.
Would you be able to tell me what the difference is between Depth Graph (All) and Depth Graph (Start) located under the Track Operation function.
Many thanks for your time,
Kelly
–
Kelly Atkins
PhD Student
School of Biological Sciences, Office 308
Bristol Life Sciences Building
University of Bristol,
24 Tyndall Ave
Bristol BS8 1TQ.
UK
tel +44 (0)117 394 1448
Attachments
Activity
I'm not sure if this is documented anywhere in the Users Guide. If not, we should do that.
I think also that a nice explanation is located in the BioViz News page from when we added this new feature to a release.
From: <Meyer>, Mason <mmeyer20@uncc.edu>
Date: Tuesday, April 21, 2015 at 2:29 PM
To: "'kelly.atkins@bristol.ac.uk'" <kelly.atkins@bristol.ac.uk>
Subject: Reply to Question regarding Depth Graph feature in IGB
Hello Kelly,
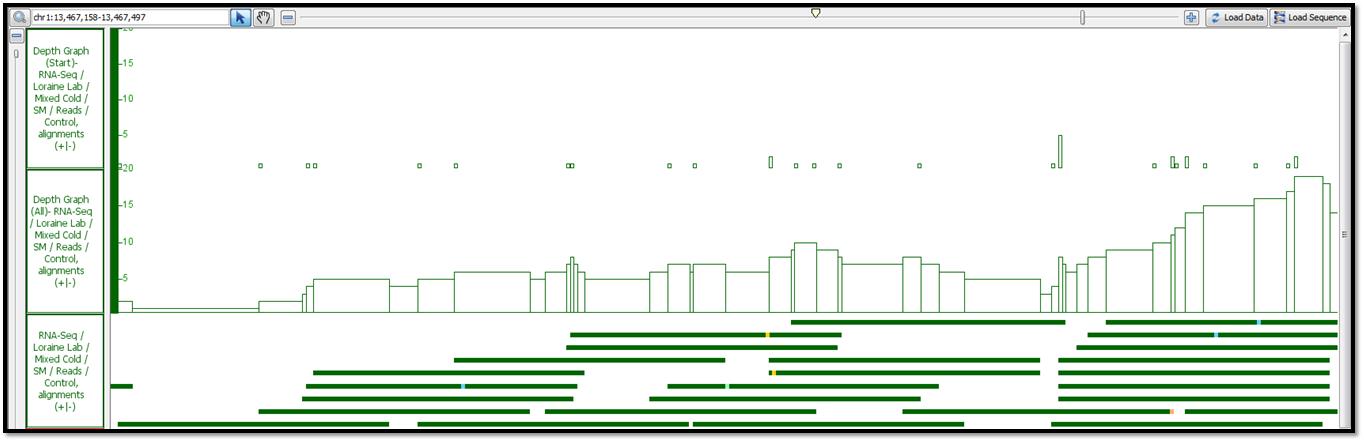
The Y-axis on the Depth Graph shows the number of overlapping annotations (or reads) covering each base. Some people call this a “coverage” graph.
The Y-axis on the Depth Graph (Start) shows the number of annotations (or reads) that start at each base.
See attached image.
The Depth Graph (Start) is most useful when assessing coverage bias in RNA-Seq or other high-throughput sequencing experiments. Often some regions are better represented than others, thanks to PCR amplification bias or other artifacts.
Please let us know if we can be of any more assistance. We hope you continue to support and cooperate with the IGB project into the future.
Thanks again,
Mason Meyer