Details
-
Type:
Task
-
Status: Closed (View Workflow)
-
Priority:
 Major
Major
-
Resolution: Done
-
Affects Version/s: None
-
Fix Version/s: None
-
Labels:None
-
Story Points:2
-
Epic Link:
-
Sprint:Summer 6: 17 Aug - 28 Aug, Summer 7: 31 Aug - 11 Sep, Fall 1: 14 Sep - 25 Sep
Description
IGB is a visual analytics tool, and expert users know how to work with it to create data-packed, visually beautiful images with IT. There are many examples in various locations, mainly in Loraine Lab "research" repositories in Bitbucket.
For this task, explore the repositories, the User's Guide, and the IGB Dropbox. Look for various images people have created.
Using them as a starting point or inspiration, create IGB-inspired images we could use as graphics for Web sites, logos, stickers, etc.
Create as many as you can and try different things. Also, try to use IGB itself to create new images. Goal here is to try different things to make striking, exciting images with interesting colors and combinations of colors.
Check out the "quick start" video made by Jay and available on the IGB YouTube channel. Follow along with it. When you get to the graph tab part, try out some of the other ways to represent a graph. The heat map option is especially nice because you can modify the color scheme.
Attachments

Activity
| Field | Original Value | New Value |
|---|---|---|
| Epic Link | IGBF-2424 [ 18604 ] |
| Rank | Ranked higher |
| Assignee | Irvin Naylor [ inaylor ] |
| Status | To-Do [ 10305 ] | In Progress [ 3 ] |
| Status | In Progress [ 3 ] | Needs 1st Level Review [ 10005 ] |
| Status | Needs 1st Level Review [ 10005 ] | First Level Review in Progress [ 10301 ] |
| Status | First Level Review in Progress [ 10301 ] | Needs 1st Level Review [ 10005 ] |
| Status | Needs 1st Level Review [ 10005 ] | First Level Review in Progress [ 10301 ] |
| Status | First Level Review in Progress [ 10301 ] | To-Do [ 10305 ] |
| Sprint | Summer 6: 17 Aug - 28 Aug [ 101 ] | Summer 6: 17 Aug - 28 Aug, Summer 7: 31 Aug - 11 Sep [ 101, 102 ] |
| Rank | Ranked higher |
| Description |
IGB is a visual analytics tool, and expert users know how to work with it to create data-packed, visually beautiful images with IT. There are many examples in various locations, mainly in Loraine Lab "research" repositories in Bitbucket.
For this task, explore the repositories, the User's Guide, and the IGB Dropbox. Look for various images people have created. Using them as a starting point or inspiration, create IGB-inspired images we could use as graphics for Web sites, stickers, etc. Create as many as you can and try different things. Also, use IGB itself to create new images. Goal here is to try different things to make striking, exciting images with interesting colors and combinations of colors. |
IGB is a visual analytics tool, and expert users know how to work with it to create data-packed, visually beautiful images with IT. There are many examples in various locations, mainly in Loraine Lab "research" repositories in Bitbucket.
For this task, explore the repositories, the User's Guide, and the IGB Dropbox. Look for various images people have created. Using them as a starting point or inspiration, create IGB-inspired images we could use as graphics for Web sites, logos, stickers, etc. Create as many as you can and try different things. Also, try to use IGB itself to create new images. Goal here is to try different things to make striking, exciting images with interesting colors and combinations of colors. |
| Description |
IGB is a visual analytics tool, and expert users know how to work with it to create data-packed, visually beautiful images with IT. There are many examples in various locations, mainly in Loraine Lab "research" repositories in Bitbucket.
For this task, explore the repositories, the User's Guide, and the IGB Dropbox. Look for various images people have created. Using them as a starting point or inspiration, create IGB-inspired images we could use as graphics for Web sites, logos, stickers, etc. Create as many as you can and try different things. Also, try to use IGB itself to create new images. Goal here is to try different things to make striking, exciting images with interesting colors and combinations of colors. |
IGB is a visual analytics tool, and expert users know how to work with it to create data-packed, visually beautiful images with IT. There are many examples in various locations, mainly in Loraine Lab "research" repositories in Bitbucket.
For this task, explore the repositories, the User's Guide, and the IGB Dropbox. Look for various images people have created. Using them as a starting point or inspiration, create IGB-inspired images we could use as graphics for Web sites, logos, stickers, etc. Create as many as you can and try different things. Also, try to use IGB itself to create new images. Goal here is to try different things to make striking, exciting images with interesting colors and combinations of colors. Tip: Check out the "quick start" video made by Jay and available on the IGB YouTube channel. Follow along with it. When you get to the graph tab part, try out some of the other ways to represent a graph. The heat map option is especially nice because you can modify the color scheme. |
| Description |
IGB is a visual analytics tool, and expert users know how to work with it to create data-packed, visually beautiful images with IT. There are many examples in various locations, mainly in Loraine Lab "research" repositories in Bitbucket.
For this task, explore the repositories, the User's Guide, and the IGB Dropbox. Look for various images people have created. Using them as a starting point or inspiration, create IGB-inspired images we could use as graphics for Web sites, logos, stickers, etc. Create as many as you can and try different things. Also, try to use IGB itself to create new images. Goal here is to try different things to make striking, exciting images with interesting colors and combinations of colors. Tip: Check out the "quick start" video made by Jay and available on the IGB YouTube channel. Follow along with it. When you get to the graph tab part, try out some of the other ways to represent a graph. The heat map option is especially nice because you can modify the color scheme. |
IGB is a visual analytics tool, and expert users know how to work with it to create data-packed, visually beautiful images with IT. There are many examples in various locations, mainly in Loraine Lab "research" repositories in Bitbucket.
For this task, explore the repositories, the User's Guide, and the IGB Dropbox. Look for various images people have created. Using them as a starting point or inspiration, create IGB-inspired images we could use as graphics for Web sites, logos, stickers, etc. Create as many as you can and try different things. Also, try to use IGB itself to create new images. Goal here is to try different things to make striking, exciting images with interesting colors and combinations of colors. Check out the "quick start" video made by Jay and available on the IGB YouTube channel. Follow along with it. When you get to the graph tab part, try out some of the other ways to represent a graph. The heat map option is especially nice because you can modify the color scheme. |
| Description |
IGB is a visual analytics tool, and expert users know how to work with it to create data-packed, visually beautiful images with IT. There are many examples in various locations, mainly in Loraine Lab "research" repositories in Bitbucket.
For this task, explore the repositories, the User's Guide, and the IGB Dropbox. Look for various images people have created. Using them as a starting point or inspiration, create IGB-inspired images we could use as graphics for Web sites, logos, stickers, etc. Create as many as you can and try different things. Also, try to use IGB itself to create new images. Goal here is to try different things to make striking, exciting images with interesting colors and combinations of colors. Check out the "quick start" video made by Jay and available on the IGB YouTube channel. Follow along with it. When you get to the graph tab part, try out some of the other ways to represent a graph. The heat map option is especially nice because you can modify the color scheme. |
| Sprint | Summer 6: 17 Aug - 28 Aug, Summer 7: 31 Aug - 11 Sep [ 101, 102 ] | Summer 6: 17 Aug - 28 Aug, Summer 7: 31 Aug - 11 Sep, Fall 1: 14 Sep - 25 Sep [ 101, 102, 103 ] |
| Rank | Ranked higher |
| Sprint | Summer 6: 17 Aug - 28 Aug, Summer 7: 31 Aug - 11 Sep, Fall 1: 14 Sep - 25 Sep [ 101, 102, 103 ] | Summer 6: 17 Aug - 28 Aug, Summer 7: 31 Aug - 11 Sep [ 101, 102 ] |
| Assignee | Irvin Naylor [ inaylor ] |
| Sprint | Summer 6: 17 Aug - 28 Aug, Summer 7: 31 Aug - 11 Sep [ 101, 102 ] | Summer 6: 17 Aug - 28 Aug, Summer 7: 31 Aug - 11 Sep, Fall 1: 14 Sep - 25 Sep [ 101, 102, 103 ] |
| Status | To-Do [ 10305 ] | In Progress [ 3 ] |
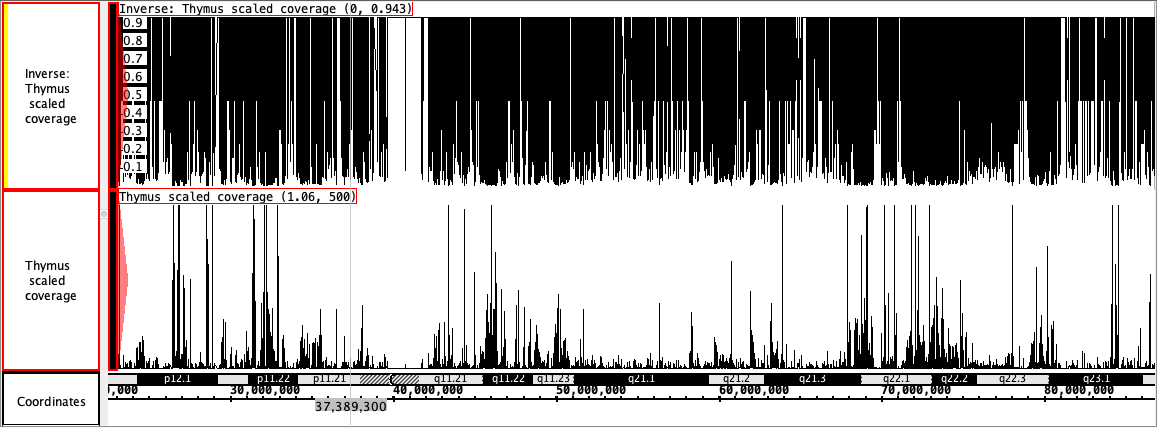
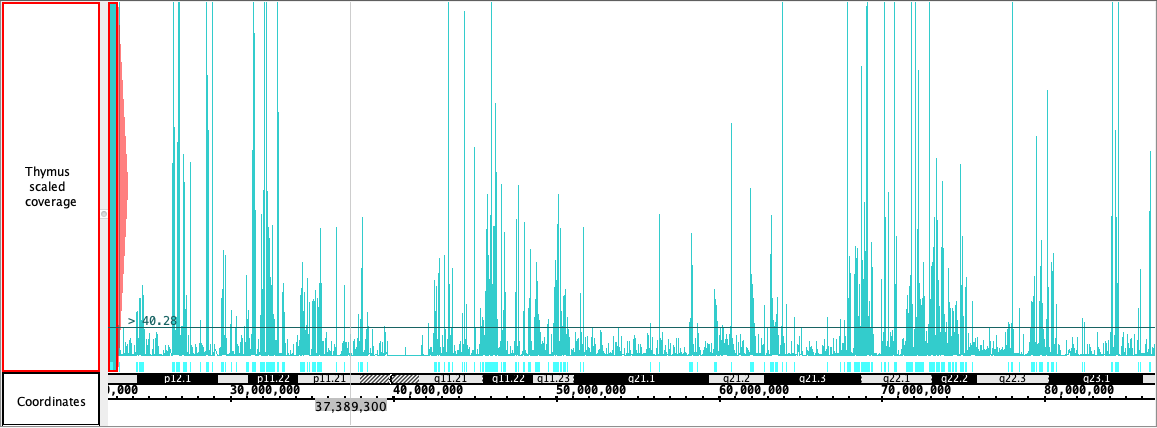
These are some of the good images I have captured.
| Attachment | MultiColor3.png [ 14871 ] | |
| Attachment | Threshold1.png [ 14872 ] | |
| Attachment | Inverse.png [ 14873 ] |
| Status | In Progress [ 3 ] | Needs 1st Level Review [ 10005 ] |
| Status | Needs 1st Level Review [ 10005 ] | First Level Review in Progress [ 10301 ] |
| Status | First Level Review in Progress [ 10301 ] | Ready for Pull Request [ 10304 ] |
| Status | Ready for Pull Request [ 10304 ] | Pull Request Submitted [ 10101 ] |
| Status | Pull Request Submitted [ 10101 ] | Reviewing Pull Request [ 10303 ] |
| Status | Reviewing Pull Request [ 10303 ] | Merged Needs Testing [ 10002 ] |
| Status | Merged Needs Testing [ 10002 ] | Post-merge Testing In Progress [ 10003 ] |
| Resolution | Done [ 10000 ] | |
| Status | Post-merge Testing In Progress [ 10003 ] | Closed [ 6 ] |
Thanks! Moving to Done.
Cip Studio Paint:
https://www.clipstudio.net/en/