Details
-
Type:
Task
-
Status: Closed (View Workflow)
-
Priority:
 Major
Major
-
Resolution: Done
-
Affects Version/s: None
-
Fix Version/s: None
-
Labels:None
-
Story Points:0.5
-
Sprint:Fall 4 2023 Oct 16
Description
It's useful to be able to quickly look at a plot showing expression levels for a given gene in a given dataset.
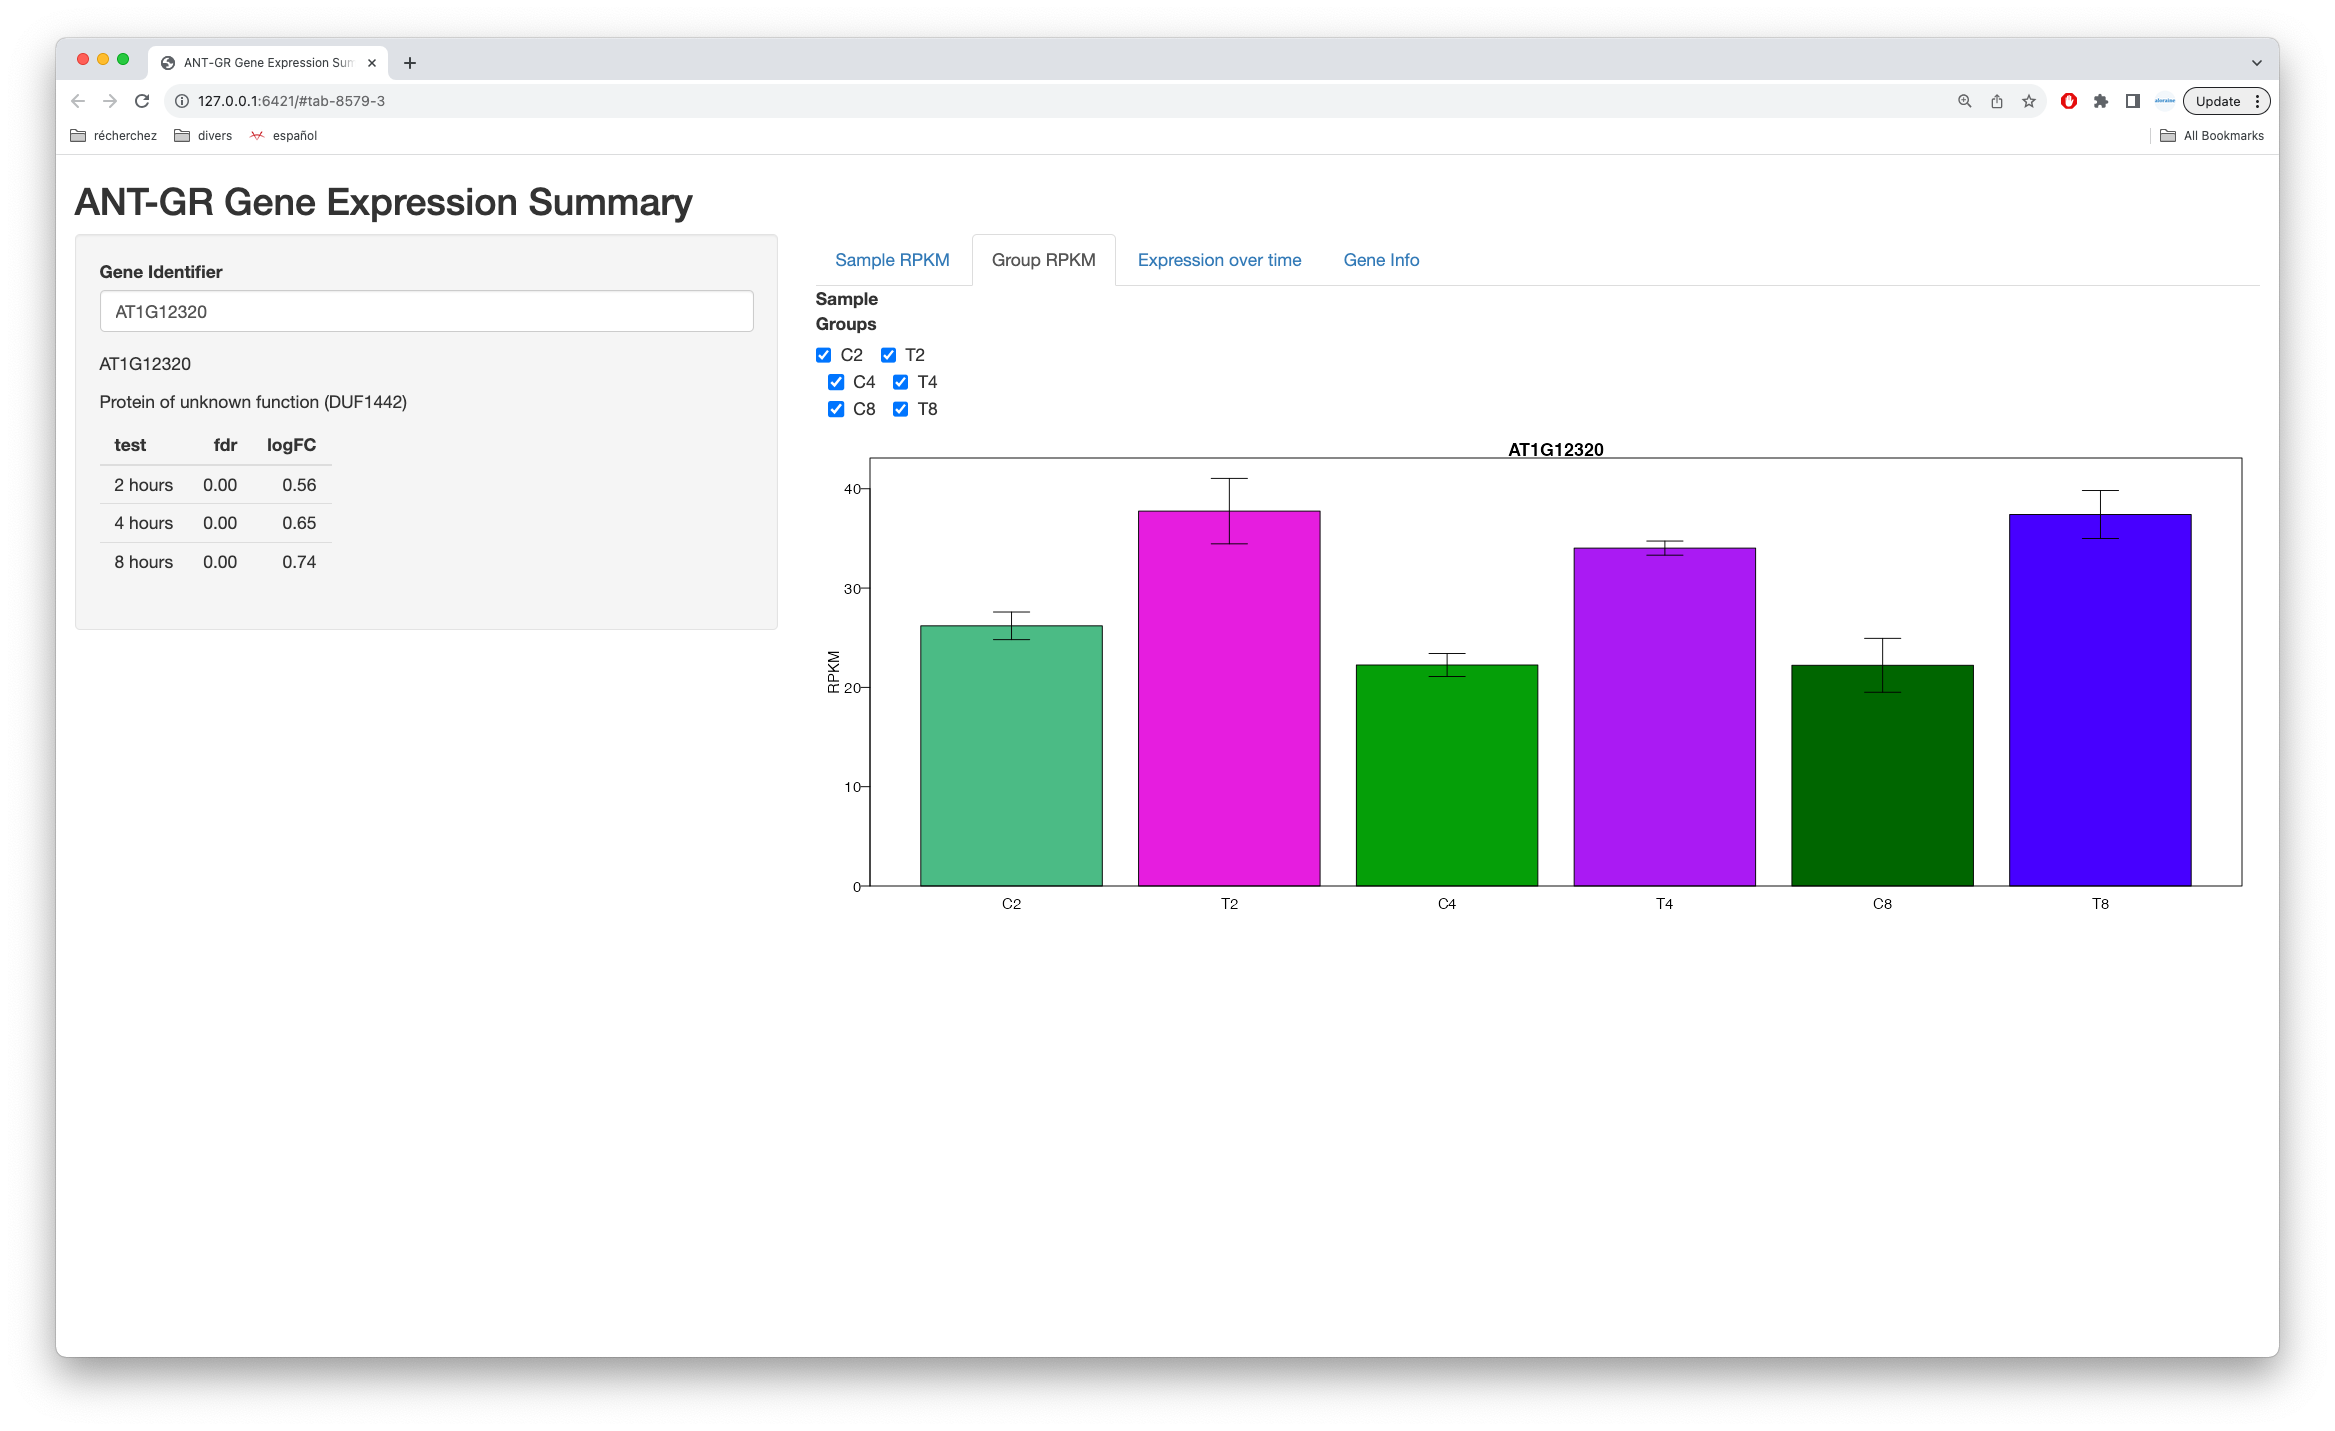
We have some code that does this. It is a function named "makeBarPlot" in Common.R in time course subdirectory of flavonoid rna-seq git repository.
For this task, investigate making an R Shiny app that can maybe do the following:
- uses data files from flavonoid-rnaseq repository
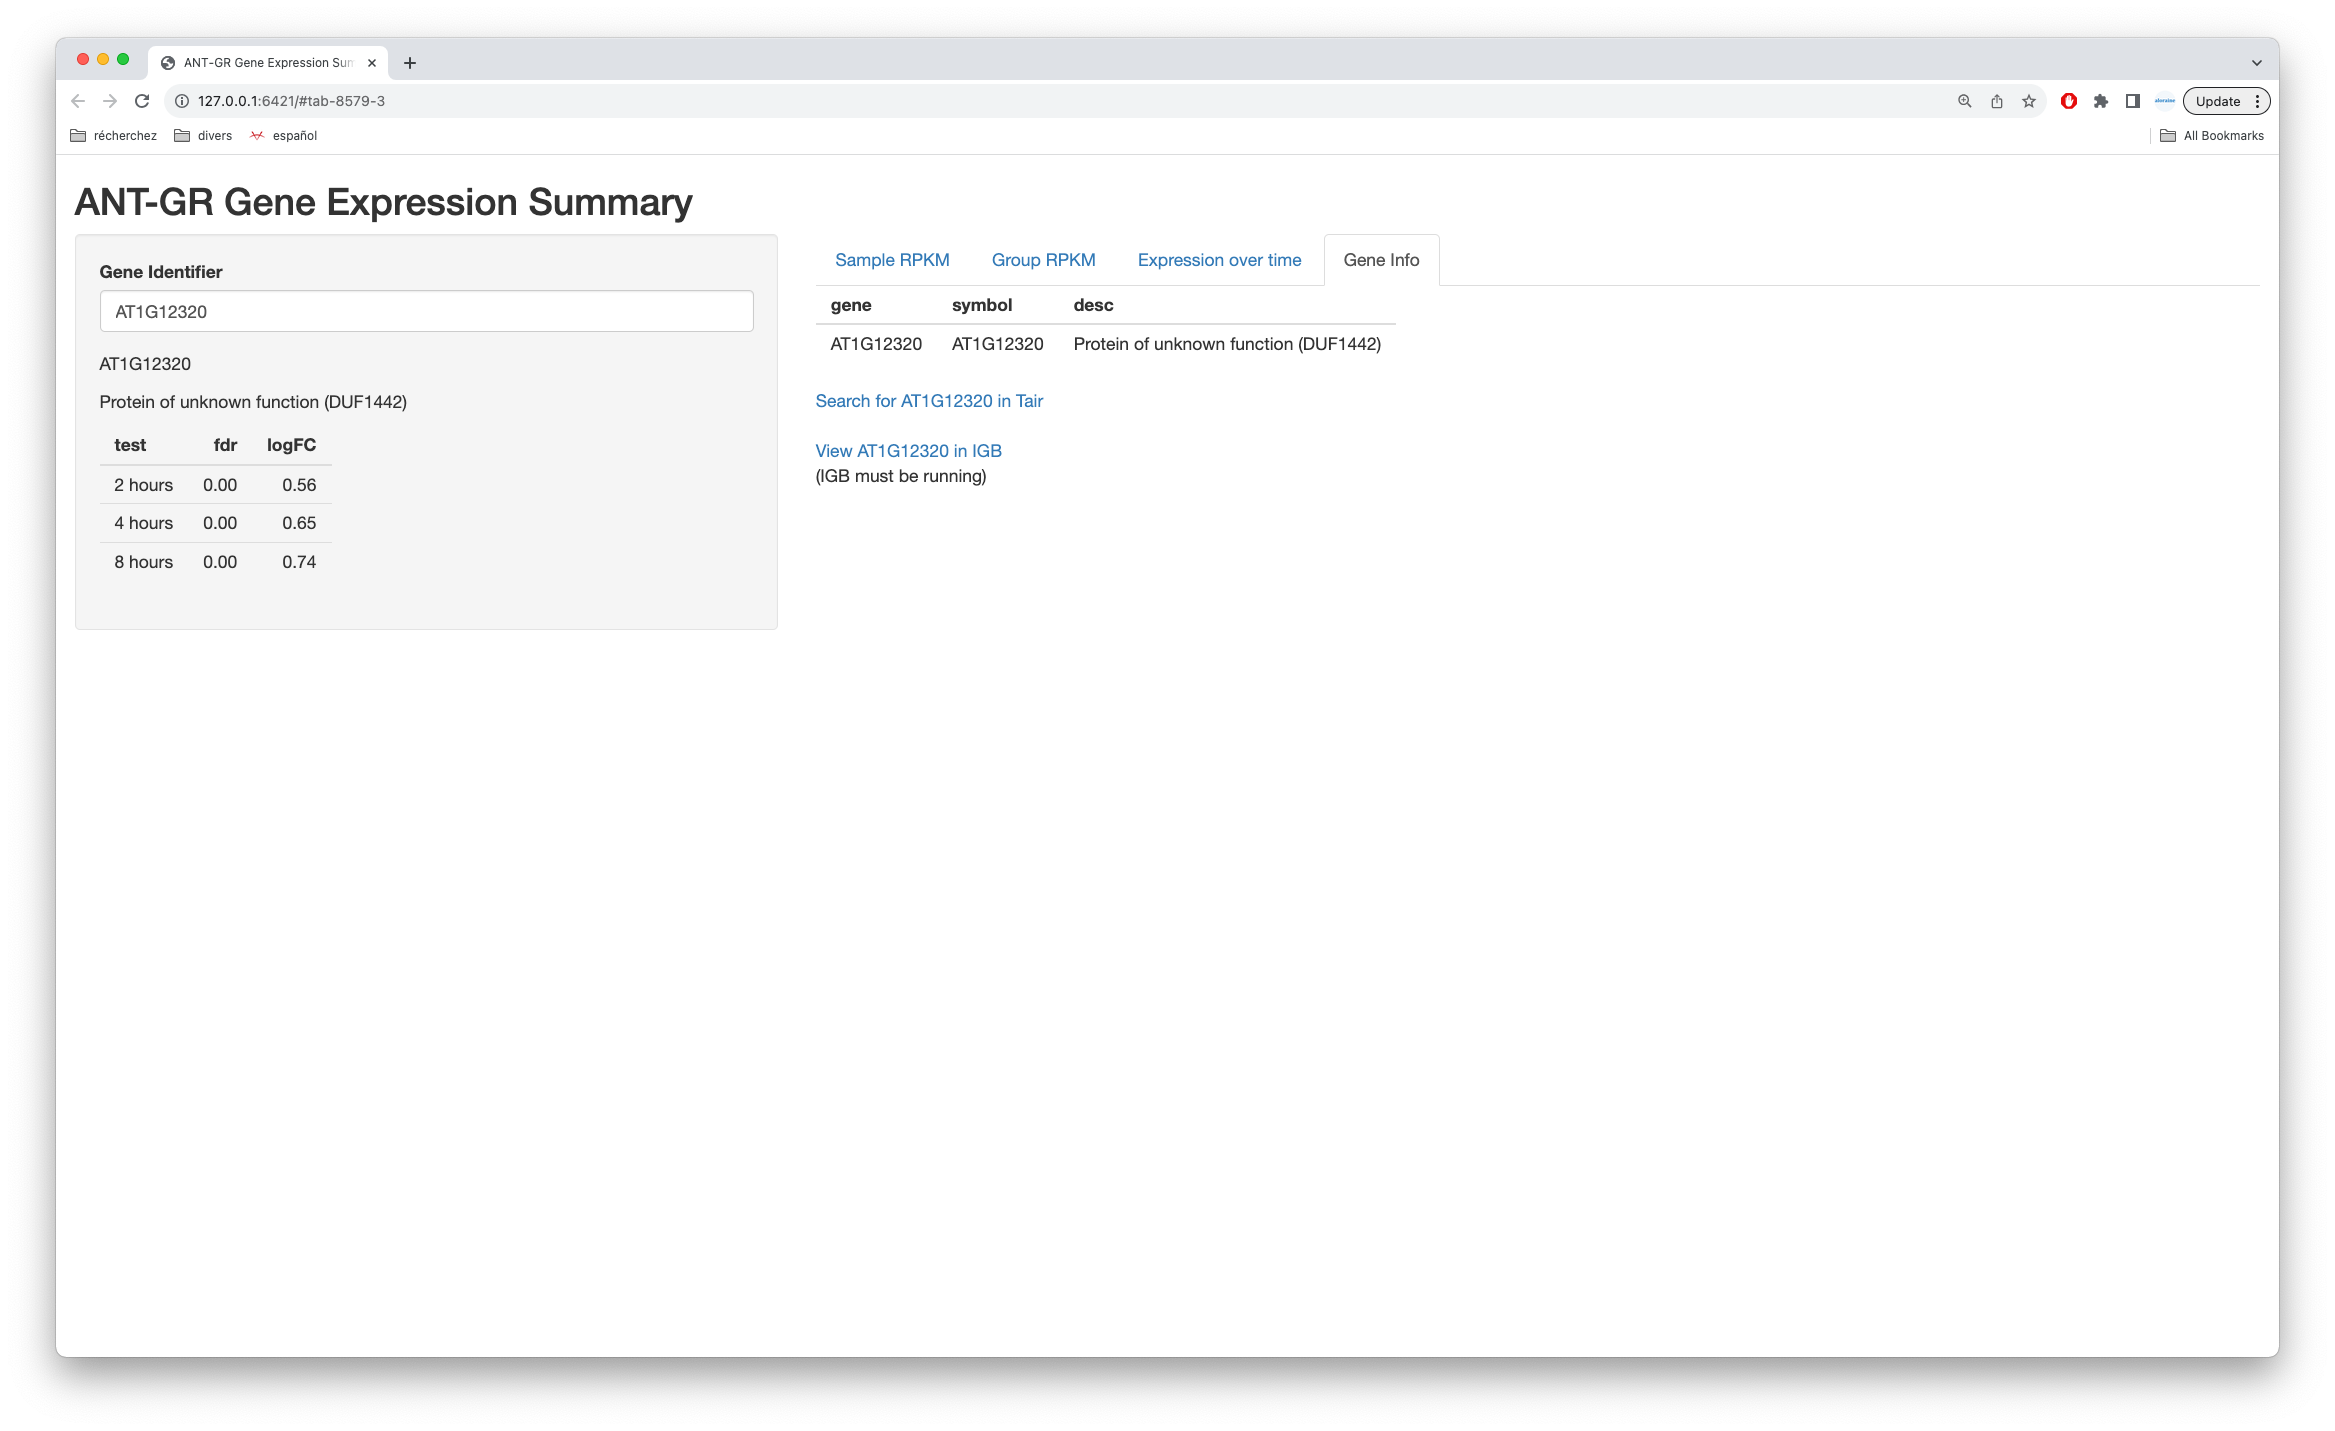
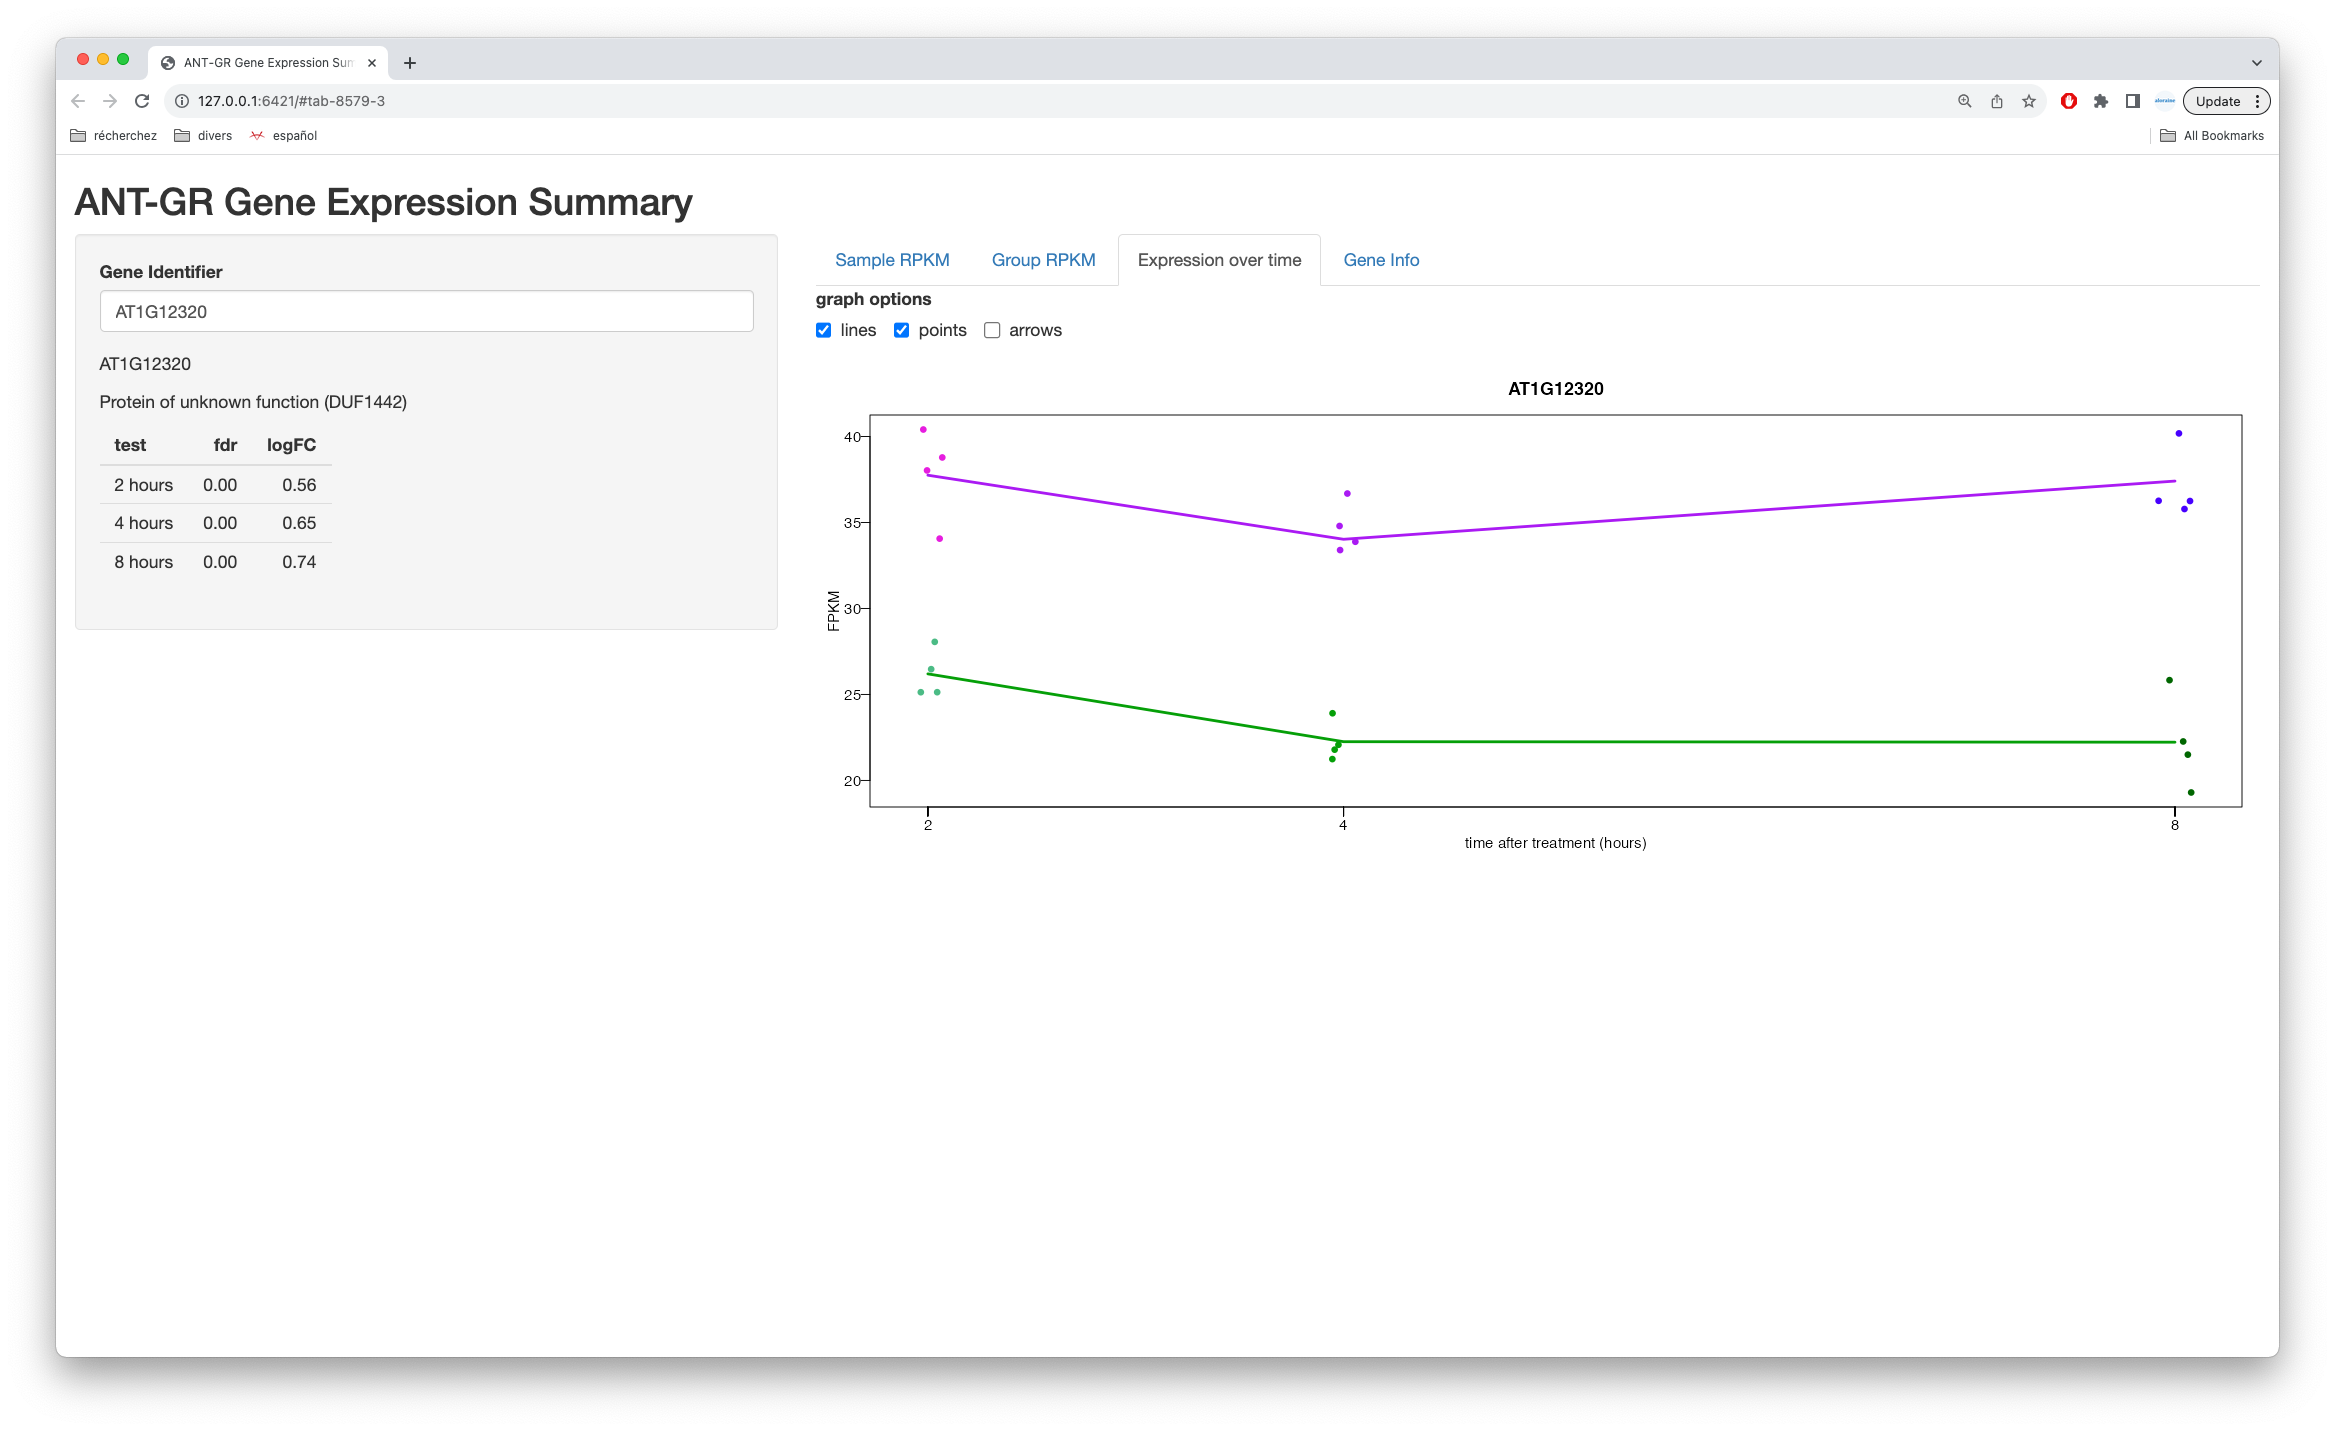
- has an interface where user enters a gene name (with useful preset default value, e.g., F3H)
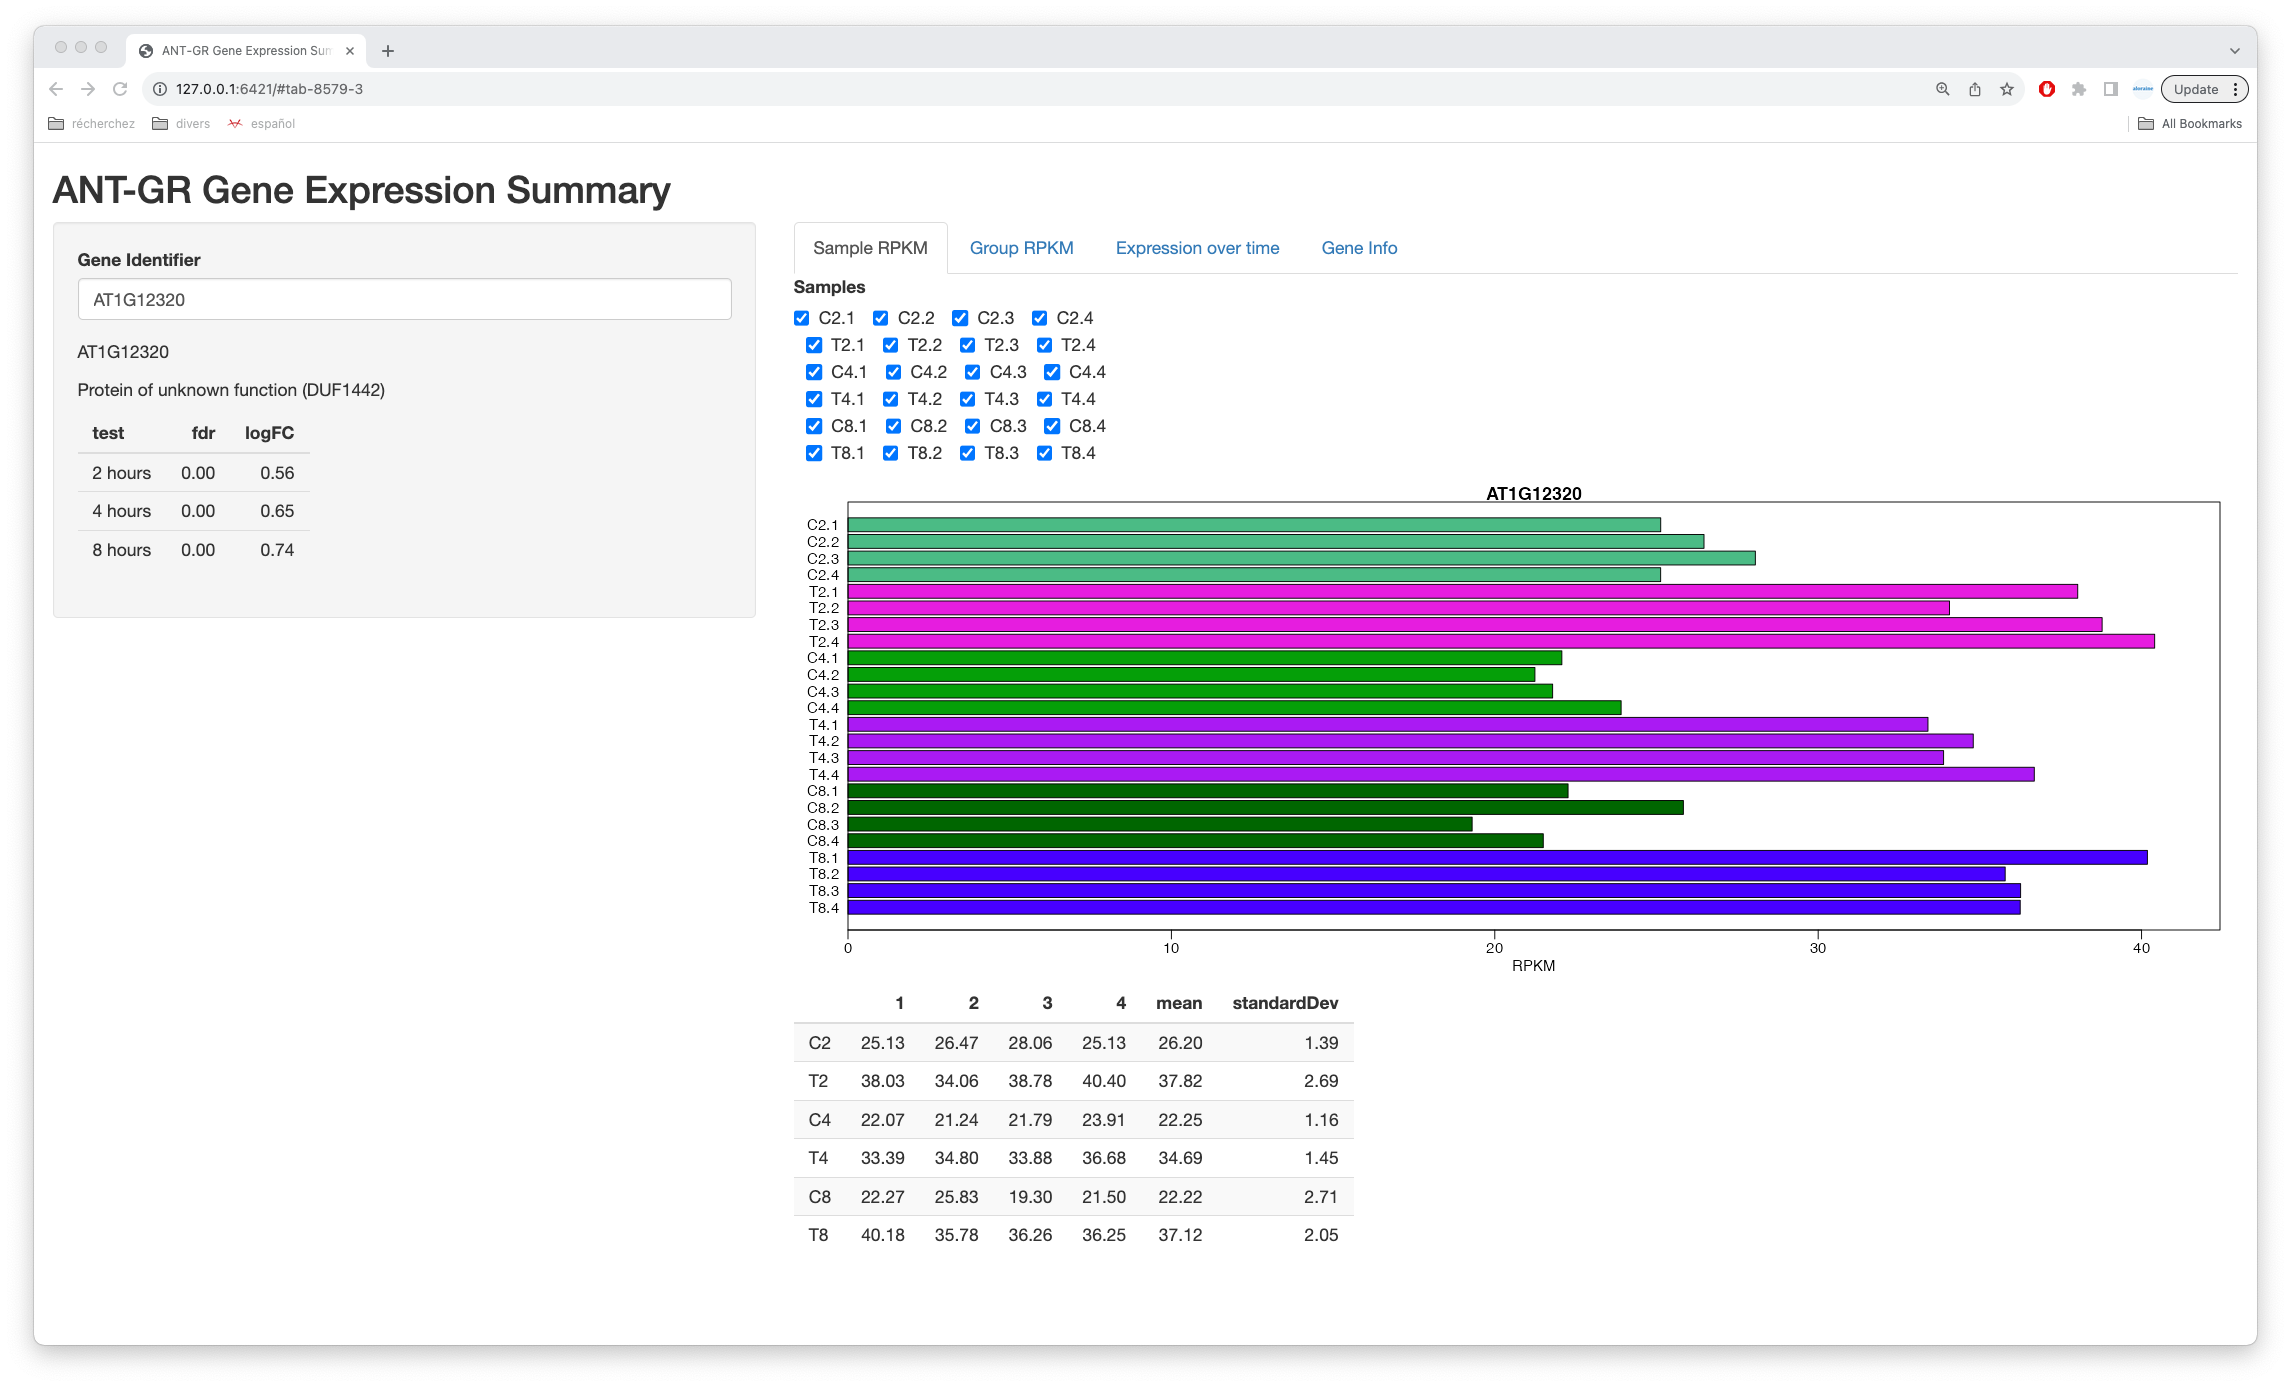
- shows barplot for that gene so the user can check that the expression levels make sense given the statistical results, and vice versa
Implementation suggestions:
- Save the Shiny App in the repository in a way that makes it easy to deploy
- Reference input datasets via relative paths to "results" folders
- Investigate deploying onto RStudio cloud because it may be crazy easy