Details
-
Type:
Task
-
Status: Closed (View Workflow)
-
Priority:
 Major
Major
-
Resolution: Done
-
Affects Version/s: None
-
Fix Version/s: 10.1.0
-
Labels:None
-
Story Points:3
-
Epic Link:
-
Sprint:Fall 2
Description
Situation: UCSC REST data is currently organized by file "type", which often separates data into large folders of bed, genePred, etc. The UCSC genome browser website uses groupings based on the data itself, for example, Genes and Gene Predictions, Expression and Regulation, etc.
Task: Organize the UCSC REST data by the "group" value provided through the API.
Attachments


Issue Links
- relates to
-
-
- Closed
-
Activity
| Field | Original Value | New Value |
|---|---|---|
| Epic Link |
|
| Story Points | 2 | 3 |
| Status | To-Do [ 10305 ] | In Progress [ 3 ] |
Investigated the approaches that me and Nowlan Freese discussed yesterday, and came up with a recursive model to parse the original API without any parameters to get the folder structure similar to UCSC: https://api.genome.ucsc.edu/list/tracks?genome=hs1. The recursion depth would be only 2 levels because of the deduction from the API response that a child can have a max of two level parents. Tried this approach with a mock testing JSON, right now, trying to implement it in IGB for the UCSC tracks and check how long it will take to parse the response. This approach will include a custom parser using the Gson library instead of using direct Gson parsing.
| Fix Version/s | 10.1.0 [ 11000 ] |
| Attachment | UCSC_new_folder_structure.png [ 18525 ] |
| Attachment | new_logic_logs.png [ 18526 ] |
| Attachment | old_logic_logs.png [ 18527 ] |
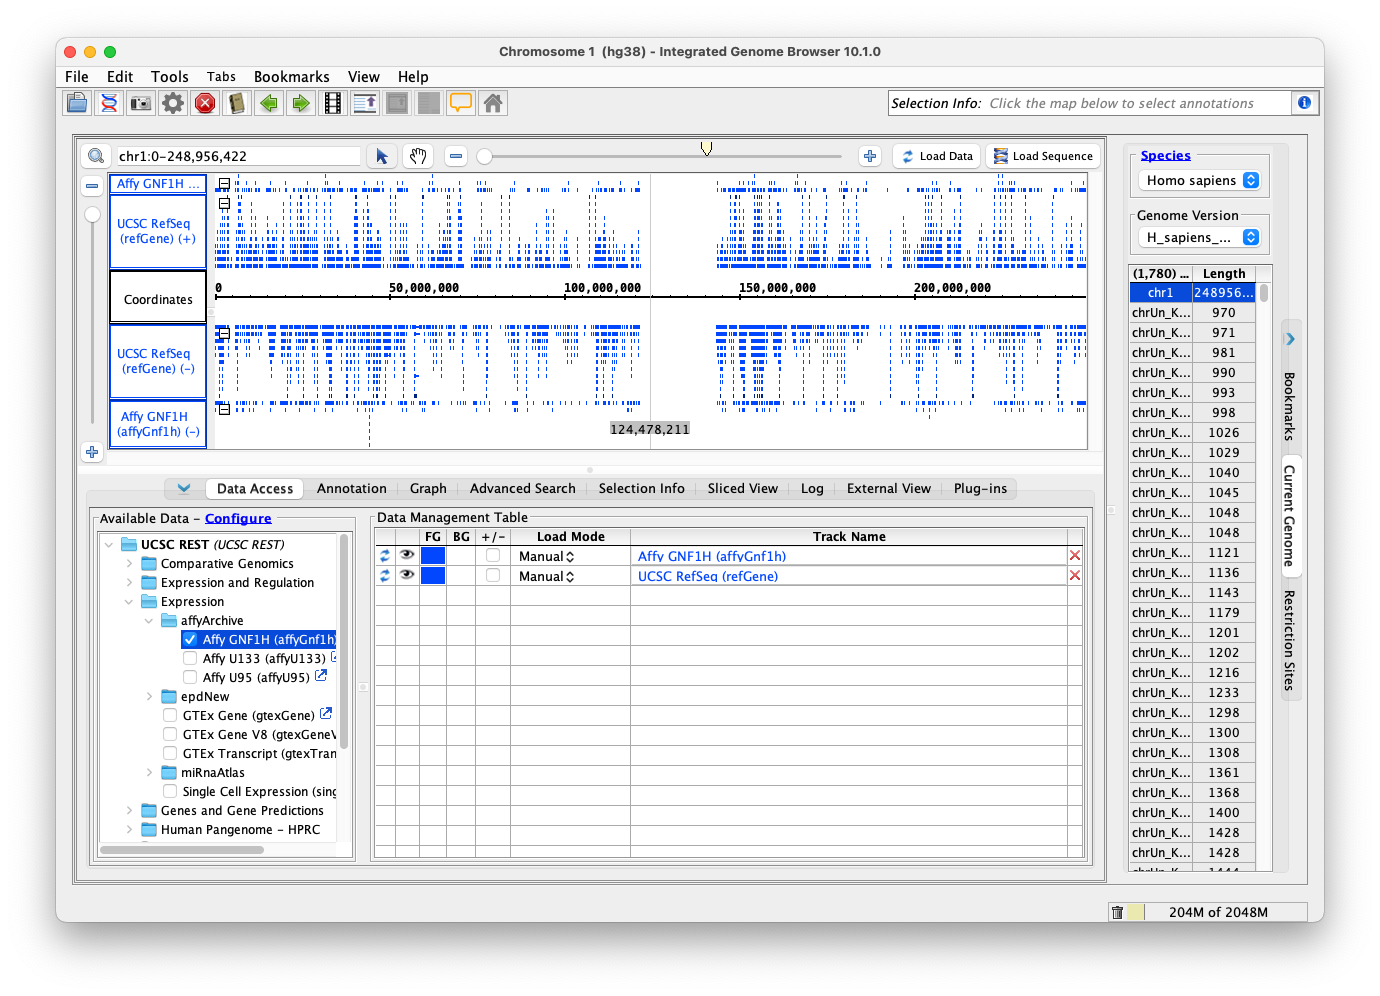
Code changes are done by implementing a custom parser using the GSON library for parsing the API response and extracting the child tracks to get the group variable from the parents. Also, for few child tracks, even though there is a parent mentioned in its info, it's not nested inside any parent and henceforth doesn't have the group value, for this category also, we decided to include them in the Other folder. Below is the screenshot of what the new folder structure looks like. Here is the updated code: https://bitbucket.org/jaya-sravani/integrated-genome-browser/branch/IGBF-3926

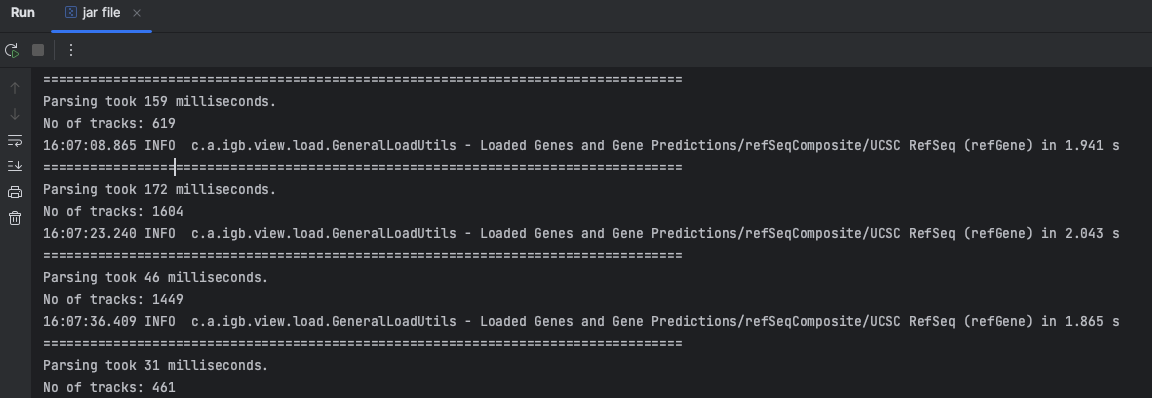
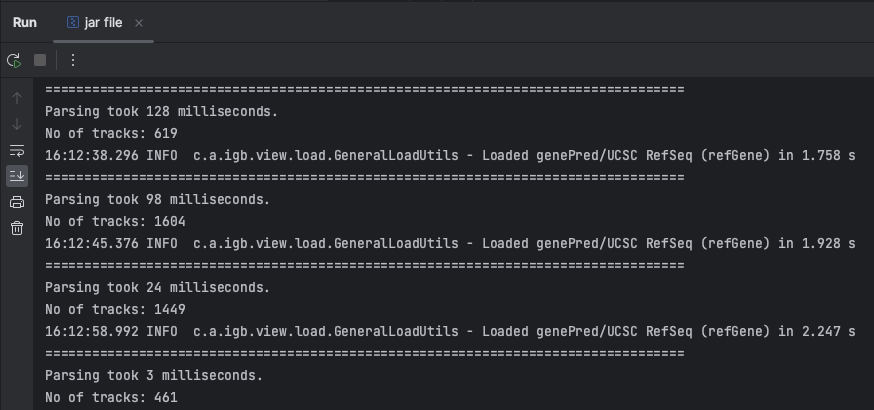
Also, I have tested how much time its taking for the new parser to parse the json and get the tracks below is the comparison between the new code and old code for hg38, hg19, hg18 and hs1 genomes, I think the new code time isn't bad comparing the value it brings to the user experience:
Please review the code and let me know if there are any issues.
| Status | In Progress [ 3 ] | Needs 1st Level Review [ 10005 ] |
| Assignee | Jaya Sravani Sirigineedi [ jsirigin ] |
| Assignee | Karthik Raveendran [ karthik ] |
| Status | Needs 1st Level Review [ 10005 ] | First Level Review in Progress [ 10301 ] |
Steps to test:
- Clone the branch, build it, and run IGB. (you can disable Ensembl Data Provider if possible to reduce the no of genomes displayed in the dropdown and make it easier for testing)
- Select any genome and any version that has datasets from the UCSC provider
- Check how the UCSC folder is structured, it should follow a structure similar to the structure present in UCSC( it's described in the ticket and comments)
How it should be structured:
datasets (or tracks) from the API should be mapped according to the below table based on the group value that's received from the API response and datasets that don't have the mapping for the group variable or don't have a group variable should be displayed in other folder and if the dataset is nested in any parent it should be inside that parent folder:
| "group": "map" | Mapping and Sequencing |
| "group": "genes" | Genes and Gene Predictions |
| "group": "phenDis" | Phenotype and Literature |
| "group": "rna" | mRNA and EST |
| "group": "regulation" | Expression and Regulation |
| "group": "compGeno" | Comparative Genomics |
| "group": "varRep" | Variation and Repeats |
| "group": "expression" | Expression |
| "group": "singleCell" | Single Cell RNA-seq |
| "group": "rep" | Repeats |
| "group": "hprc" | Human Pangenome - HPRC |
| Status | First Level Review in Progress [ 10301 ] | Ready for Pull Request [ 10304 ] |
Testing completed. The tracks fall under the folders mentioned in the above table. Recommending Pull request.
| Assignee | Karthik Raveendran [ karthik ] | Jaya Sravani Sirigineedi [ jsirigin ] |
Raised the pull request: https://bitbucket.org/lorainelab/integrated-genome-browser/pull-requests/1043
| Status | Ready for Pull Request [ 10304 ] | Pull Request Submitted [ 10101 ] |
| Assignee | Jaya Sravani Sirigineedi [ jsirigin ] |
PR is merged and new installers are built and deployed to bioviz.org "early access" section. Ready for testing.
| Status | Pull Request Submitted [ 10101 ] | Reviewing Pull Request [ 10303 ] |
| Status | Reviewing Pull Request [ 10303 ] | Merged Needs Testing [ 10002 ] |
Karthik Raveendran - could you test one more time - to check nothing went wrong with the final merge?
| Assignee | Karthik Raveendran [ karthik ] |
| Status | Merged Needs Testing [ 10002 ] | Post-merge Testing In Progress [ 10003 ] |
Post-merge testing is completed. Moving to close.
| Resolution | Done [ 10000 ] | |
| Status | Post-merge Testing In Progress [ 10003 ] | Closed [ 6 ] |
| Assignee | Karthik Raveendran [ karthik ] | Jaya Sravani Sirigineedi [ jsirigin ] |
Mapping the "group" values to what UCSC shows in their browser.
Note: I looked at the T2T, the hg38, and mm39 API responses. The below table should encompass most of the "group" values that are present at UCSC, though I haven't been able to find a webpage or API call that lists all of the mappings.
Unfortunately where this gets complicated is for the data that are in folders on UCSC site. Since we are passing the trackLeavesOnly=1 parameter to the API, we aren't able to see the "parent". I've included an example below where I do not pass the trackLeavesOnly=1 to the API.
    "T2T_Encode": {
      "compositeContainer": "TRUE",
      "shortLabel": "T2T Encode",
      "type": "bed 3",
      "longLabel": "T2T Encode Reanalysis",
      "sortOrder": "cell=+ ab=+ view=+",
      "subGroup1": "cell Cell_Line CL_22Rv1=22Rv1 BE2C=BE2C C4-2B=C4-2B Caco-2=Caco-2 HAP-1=HAP-1 HL-60=HL-60 MG63=MG63 RWPE1=RWPE1 RWPE2=RWPE2 SJCRH30=SJCRH30 SJSA1=SJSA1 VCaP=VCaP bmec=brain_microvascular_endothelial_cell ecopm=epithelial_cell_of_prostate_male",
      "visibility": "hide",
      "subGroup2": "ab Antibody CTCF=CTCF Control=Control H3K27ac=H3K27ac H3K27me3=H3K27me3 H3K36me3=H3K36me3 H3K4me1=H3K4me1 H3K4me3=H3K4me3 H3K9me3=H3K9me3",
      "subGroup3": "view View coverage=Coverage enrichment=Enrichment peaks=Macs2_Peaks LOpeaks=Macs2_hg38_LO_Peaks",
      "group": "regulation",
      "html": "T2T_Encode.html",
      "compositeTrack": "on",
      "dimensions": "dimX=cell dimY=ab",
      "T2T_Encode_Coverage": {
        "compositeViewContainer": "TRUE",
        "shortLabel": "Encode Coverage",
        "type": "bigWig",
        "longLabel": "Encode Coverage",
        "parent": "T2T_Encode",
        "visibility": "full",
        "maxHeightPixels": "100:20:10",
        "windowingFunction": "mean",
        "view": "coverage",
        "autoScale": "on",
        "T2T_Encode_Coverage_BE2C.Control": {
          "shortLabel": "BE2C Control",
          "type": "bigWig",
          "longLabel": "BE2C Control Coverage",
          "parent": "T2T_Encode_Coverage",
          "parentParent": "T2T_Encode",
          "subGroups": "cell=BE2C ab=Control view=coverage",
          "bigDataUrl": "/gbdb/hs1/encode/coverage/BE2C.Control.chm13v2.0.bw"
        },
The parent, T2T_Encode, has a group value of regulation. It is a folder that contains subfolders (for example T2T_Encode_Coverage) which then contain data (for example T2T_Encode_Coverage_BE2C.Control). I think the best approach would be to emulate the organization that UCSC has, that way a user would see the same organization.