Emails exchanged:
Hi Ann,
It’s a bedgraph format file of ChIP-seq data from Saccharomyces cerevisiae generated with Macs2. The link to the zipped file is https://drive.google.com/file/d/1xEbIsDGIzLVyYiRtNDNar0Jnp8ynTohz/view?usp=sharing
A wiggle file generated from the bedgraph file gives the same black bar.
Kind regards,
Hugh
From: Ann Loraine <Ann.Loraine@uncc.edu>
Sent: Monday, November 19, 2018 5:16 PM
To: Patterton, H, Prof [hpatterton@sun.ac.za] <hpatterton@sun.ac.za>
Subject: Re: [JIRA] (HELP-312) Think Y axis bar interferes
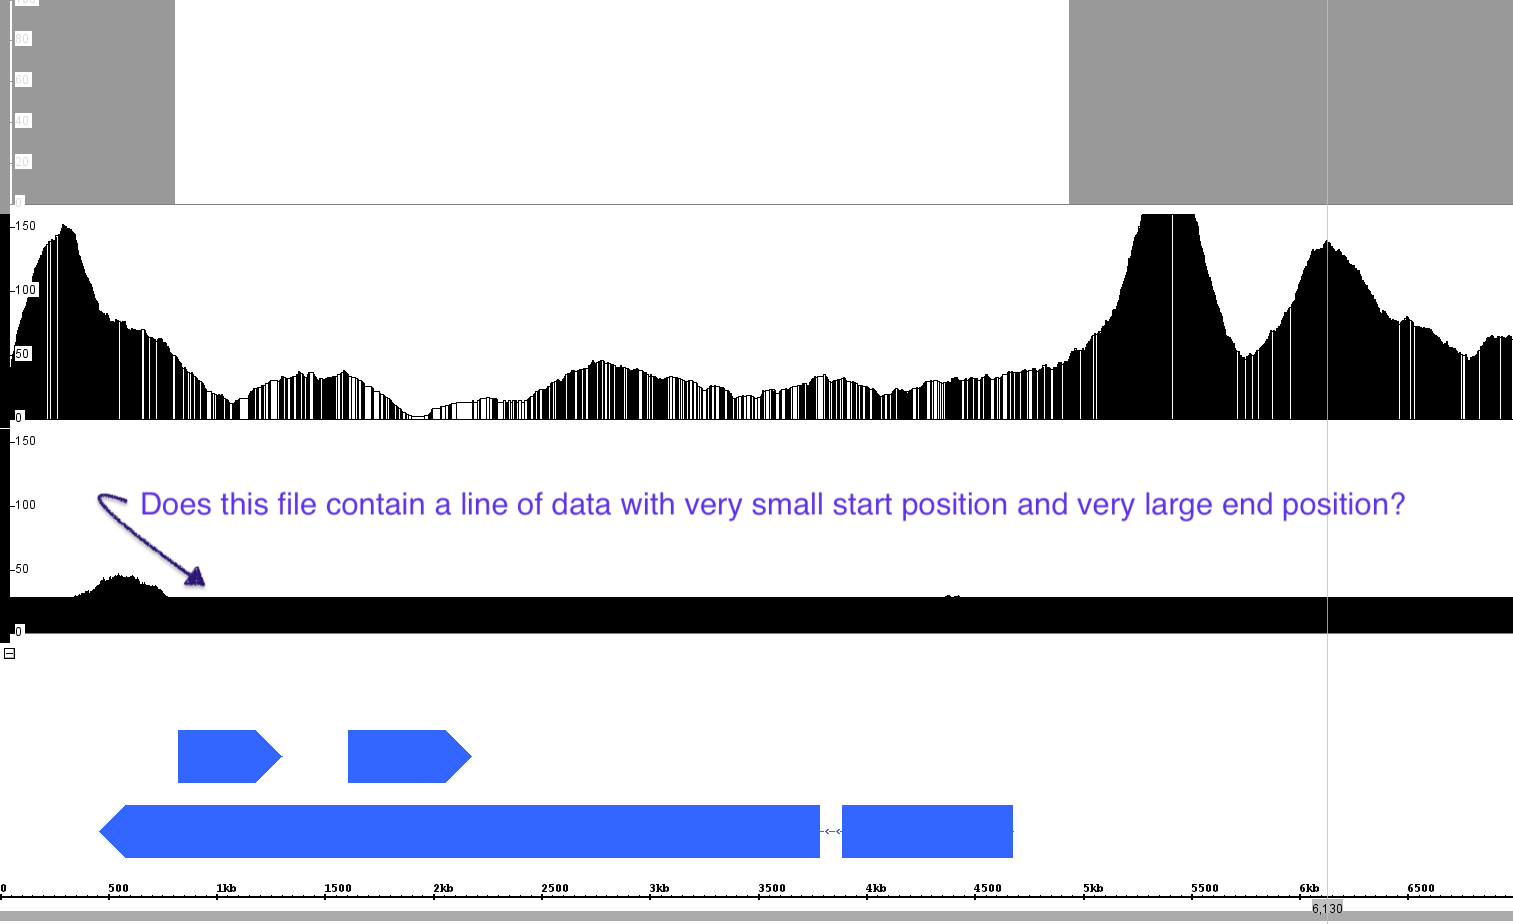
Thank you for sending the images. I have not seen this effect before — I wonder if there is a line of data indicating a region that spans the entire chromosome?
Could you send me the file, as well, so that I can investigate further? I don't need to know the details of what it represents - just the format and the name of the reference genome assembly.
On Wed, Nov 14, 2018 at 6:30 AM Patterton, H, Prof [hpatterton@sun.ac.za] <hpatterton@sun.ac.za> wrote:
Hi Ann,
Thanks for the quick reply.
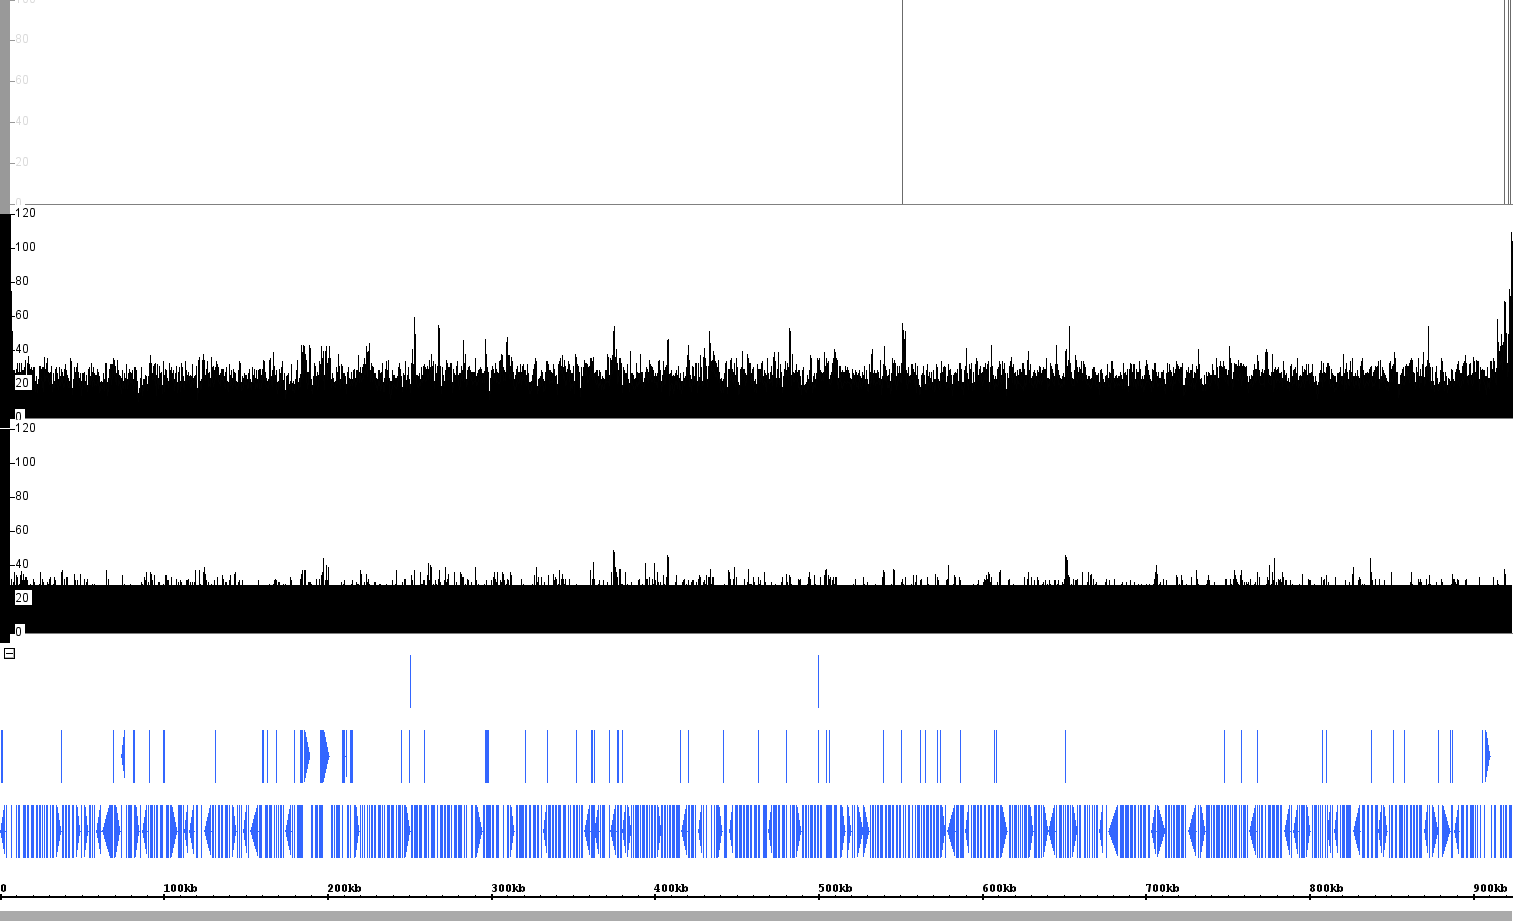
I attach two images. One full size, and the other zoomed in. Note that the left peak visible in the second track from the top (in the zoomed image) is not visible in the full image due to the thick black bar. I would like to show the peaks at both telomeric ends in the full chromosome display.
You may upload the images to internet… 
Kind regards,
Hugh
From: Ann Loraine <Ann.Loraine@uncc.edu>
Sent: Wednesday, November 14, 2018 1:16 PM
To: Patterton, H, Prof [hpatterton@sun.ac.za] <hpatterton@sun.ac.za>
Subject: Re: [JIRA] (HELP-312) Think Y axis bar interferes
Hello,
Thank you for taking the time to request and suggest improvements to the IGB software.
I have a follow-up question:
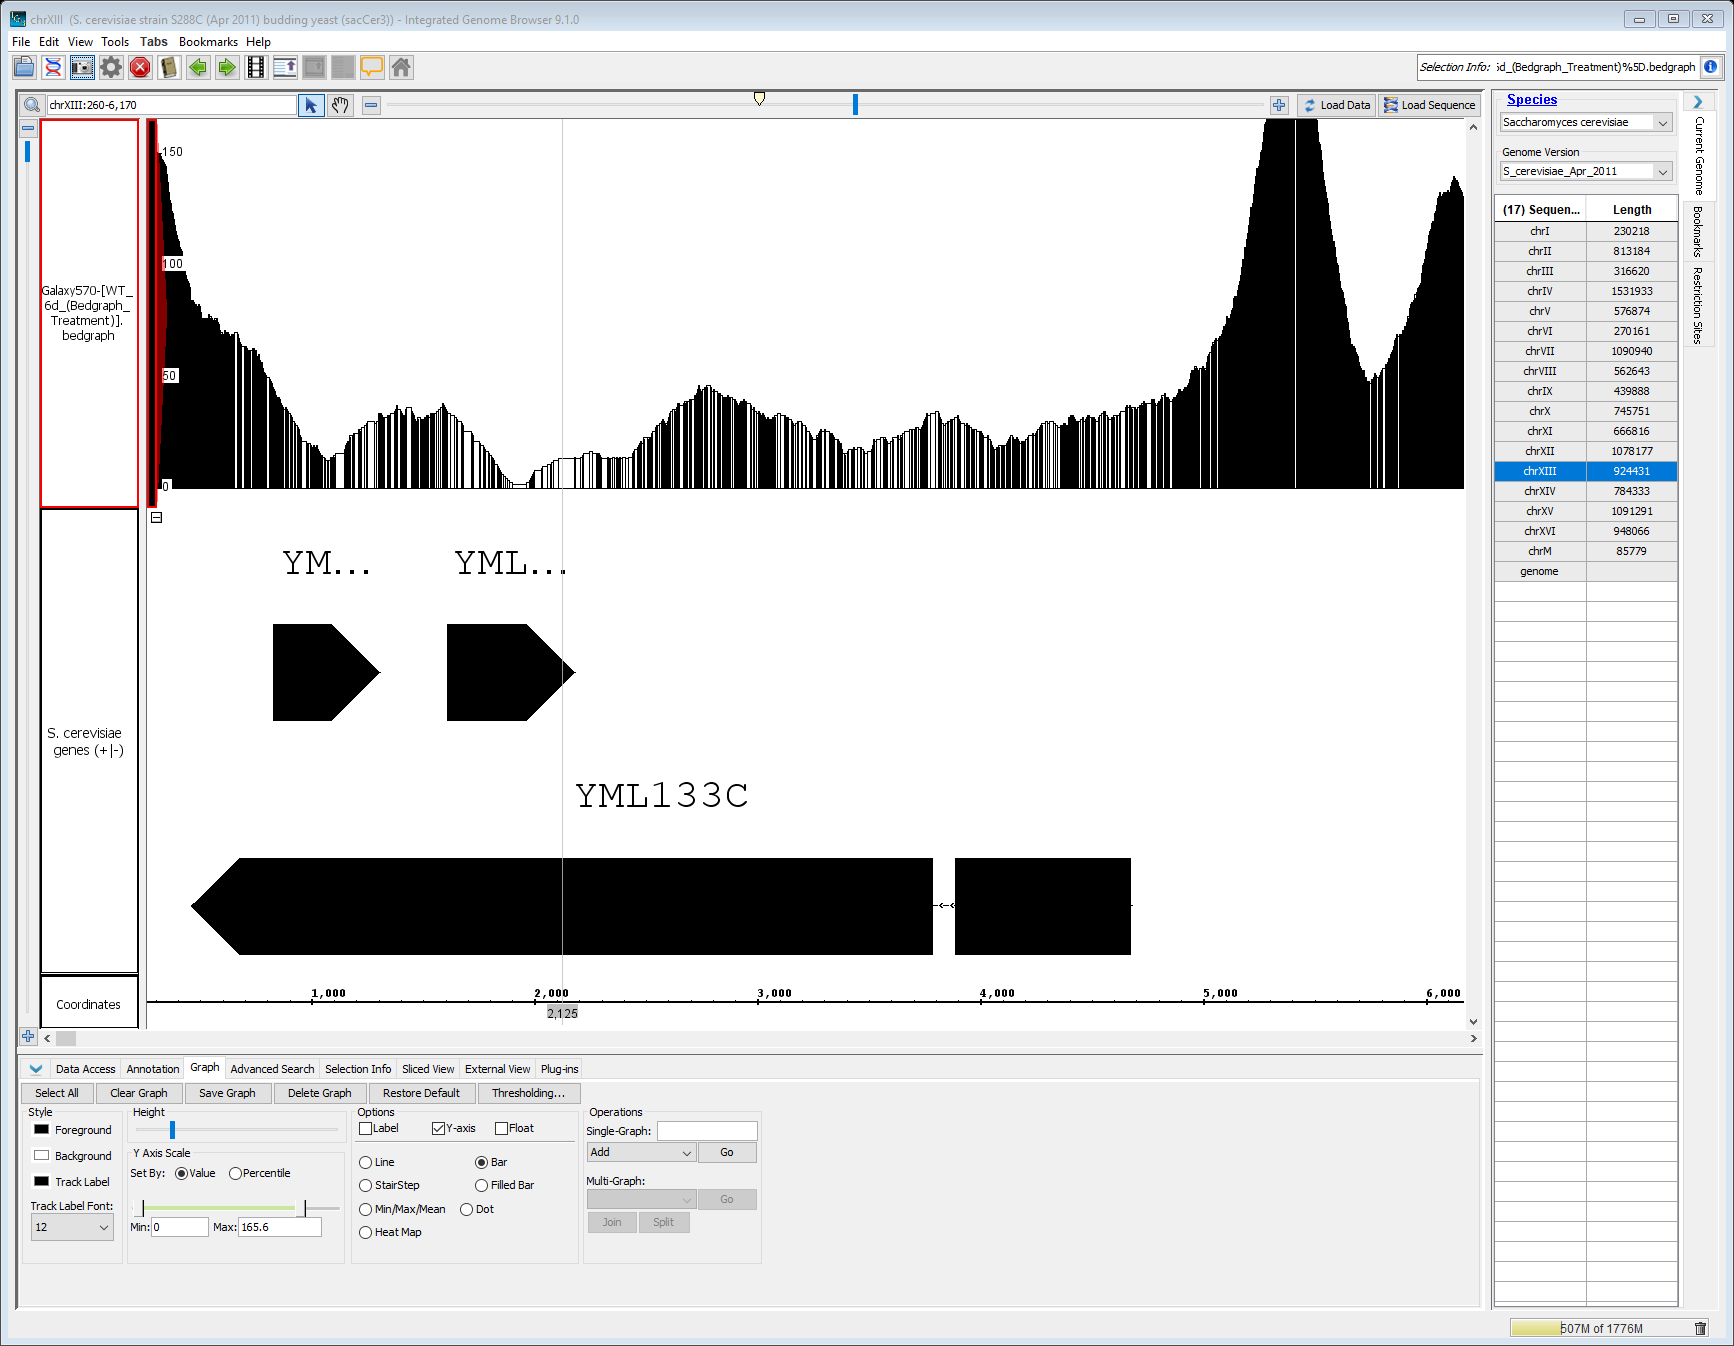
Do you mean the y-axis indicator on a graph track? (See attached.)
It is possible to hide or show the numeric markings, but currently not the black bar itself.
I would have to look at the code, but I'm pretty confident we can make it an option to hide or show the entire y-axis indicator - not just the numbers. We discussed doing this some years ago, but were not sure it was an option users would want.
If you are able to send me an image of your own that you would not mind being shared with others, that would be super-helpful. ("Others" meaning: the internet
Thank you for using IGB and best of luck in your research!
Yours,
Ann Loraine
On Wed, Nov 14, 2018 at 3:26 AM, Support (JIRA) <lorainelabuncc@gmail.com> wrote:
Support created an issue
User Support / BugHELP-312
Think Y axis bar interferes
Issue Type:
BugBug
Assignee:
Ann Loraine
Created:
14/Nov/18 8:25 AM
Labels:
collector-b04cfbf9
Reporter:
Support
Hi,
There is a think, black bar at the extreme left at the Y-axis of every track. This bar obscures data that may lie at the telomeres. Is there any reason to have this thick bar? Can it be removed? Perhaps add an option to either display or hide the thick axis?
Reporter: Hugh Patterton
E-mail: hpatterton@sun.ac.za
Bug
IGBF-1474 Investigate why bedgraph file shows long dark block

Emails exchanged:
Hi Ann,
It’s a bedgraph format file of ChIP-seq data from Saccharomyces cerevisiae generated with Macs2. The link to the zipped file is https://drive.google.com/file/d/1xEbIsDGIzLVyYiRtNDNar0Jnp8ynTohz/view?usp=sharing
A wiggle file generated from the bedgraph file gives the same black bar.
Kind regards,
Hugh
From: Ann Loraine <Ann.Loraine@uncc.edu>
Sent: Monday, November 19, 2018 5:16 PM
To: Patterton, H, Prof [hpatterton@sun.ac.za] <hpatterton@sun.ac.za>
Subject: Re: [JIRA] (
HELP-312) Think Y axis bar interferesThank you for sending the images. I have not seen this effect before — I wonder if there is a line of data indicating a region that spans the entire chromosome?
Could you send me the file, as well, so that I can investigate further? I don't need to know the details of what it represents - just the format and the name of the reference genome assembly.
On Wed, Nov 14, 2018 at 6:30 AM Patterton, H, Prof [hpatterton@sun.ac.za] <hpatterton@sun.ac.za> wrote:
Hi Ann,
Thanks for the quick reply.
I attach two images. One full size, and the other zoomed in. Note that the left peak visible in the second track from the top (in the zoomed image) is not visible in the full image due to the thick black bar. I would like to show the peaks at both telomeric ends in the full chromosome display.
You may upload the images to internet…
Kind regards,
Hugh
From: Ann Loraine <Ann.Loraine@uncc.edu>
Sent: Wednesday, November 14, 2018 1:16 PM
To: Patterton, H, Prof [hpatterton@sun.ac.za] <hpatterton@sun.ac.za>
Subject: Re: [JIRA] (
HELP-312) Think Y axis bar interferesHello,
Thank you for taking the time to request and suggest improvements to the IGB software.
I have a follow-up question:
Do you mean the y-axis indicator on a graph track? (See attached.)
It is possible to hide or show the numeric markings, but currently not the black bar itself.
I would have to look at the code, but I'm pretty confident we can make it an option to hide or show the entire y-axis indicator - not just the numbers. We discussed doing this some years ago, but were not sure it was an option users would want.
If you are able to send me an image of your own that you would not mind being shared with others, that would be super-helpful. ("Others" meaning: the internet
Thank you for using IGB and best of luck in your research!
Yours,
Ann Loraine
On Wed, Nov 14, 2018 at 3:26 AM, Support (JIRA) <lorainelabuncc@gmail.com> wrote:
Support created an issue
User Support / BugHELP-312
Think Y axis bar interferes
Issue Type:
BugBug
Assignee:
Ann Loraine
Created:
14/Nov/18 8:25 AM
Labels:
collector-b04cfbf9
Reporter:
Support
Hi,
There is a think, black bar at the extreme left at the Y-axis of every track. This bar obscures data that may lie at the telomeres. Is there any reason to have this thick bar? Can it be removed? Perhaps add an option to either display or hide the thick axis?
Reporter: Hugh Patterton
E-mail: hpatterton@sun.ac.za