Details
-
Type:
Task
-
Status: Closed (View Workflow)
-
Priority:
 Major
Major
-
Resolution: Done
-
Affects Version/s: None
-
Fix Version/s: None
-
Labels:None
-
Story Points:3
-
Epic Link:
-
Sprint:Summer 5: 3 Aug - 14 Aug, Summer 6: 17 Aug - 28 Aug, Summer 7: 31 Aug - 11 Sep, Fall 1: 14 Sep - 25 Sep
Description
Welcome to your first on-boarding task for the IGB core development team!
We are super excited you have joined us! We hope you will enjoy your time with us and will make big contributions to the code base and the IGB community.
For this on-boarding task, please do the following:
- Go to https://canvas.instructure.com and make a free account.
- Log in and enroll in https://canvas.instructure.com/courses/1164217
- In Module I of the course, read: IGB Background and Intro to IGB Data Visualization
- Download and install the current release of IGB onto your computer.
- Using IGB, copy the actions shown in this IGB video: https://www.youtube.com/watch?v=LjPNT1k9cqk
- Re-create the scene shown at the very end of the video.
- Use the camera button in the IGB toolbar to take a picture of IGB showing the scene at the end of the video; upload it here
Reviewers:
- Watch https://www.youtube.com/watch?v=LjPNT1k9cqk
- Confirm that the assignee has uploaded an image with graphs loaded and configured to the same scale as each other, as shown in the video
- Confirm that the assignee has enrolled in the class.
Attachments
Issue Links
- blocks
-
-

- Closed
-
Activity
Irvin Naylor - You're "up next" to do this on-boarding training. Sai Supreeth Segu - could you show Irvin Naylor what you've picked up from using IGB thus far? It would be super useful also if Sai Supreeth Segu and Irvin Naylor can make a note of aspects you found confusing or strange as this will help us identify aspects of the UI that need improvement.
Question for Sai Supreeth Segu: Can you let me know why you were trying to save the graph? I wonder if maybe there was some confusion between the "save" function for tracks and the "take a picture" function? IGB has a feature that lets you create an image file that shows all or part of the IGB user interface. Was this the feature that you were trying to use? To use that feature, you can click the toolbar icon that looks like a camera.
Sai Supreeth Segu - Kindly solve the issue and then push to first level review.
I was able to set Minimum and Maximum for all the graphs but I was getting an error when I am saving the graph.
Use "attach files" option under More menu in Jira ticket. This is better than embedding the image into the page because the image is too big.
Irvin Naylor - I think you have missed this part.
i) Upload an image with graphs loaded and configured to the same scale as each other, as shown in the video and also please go through the follow-up request by Dr. Ann Loraine. These are requests provided by the Professor from the above comments.
Request 1:
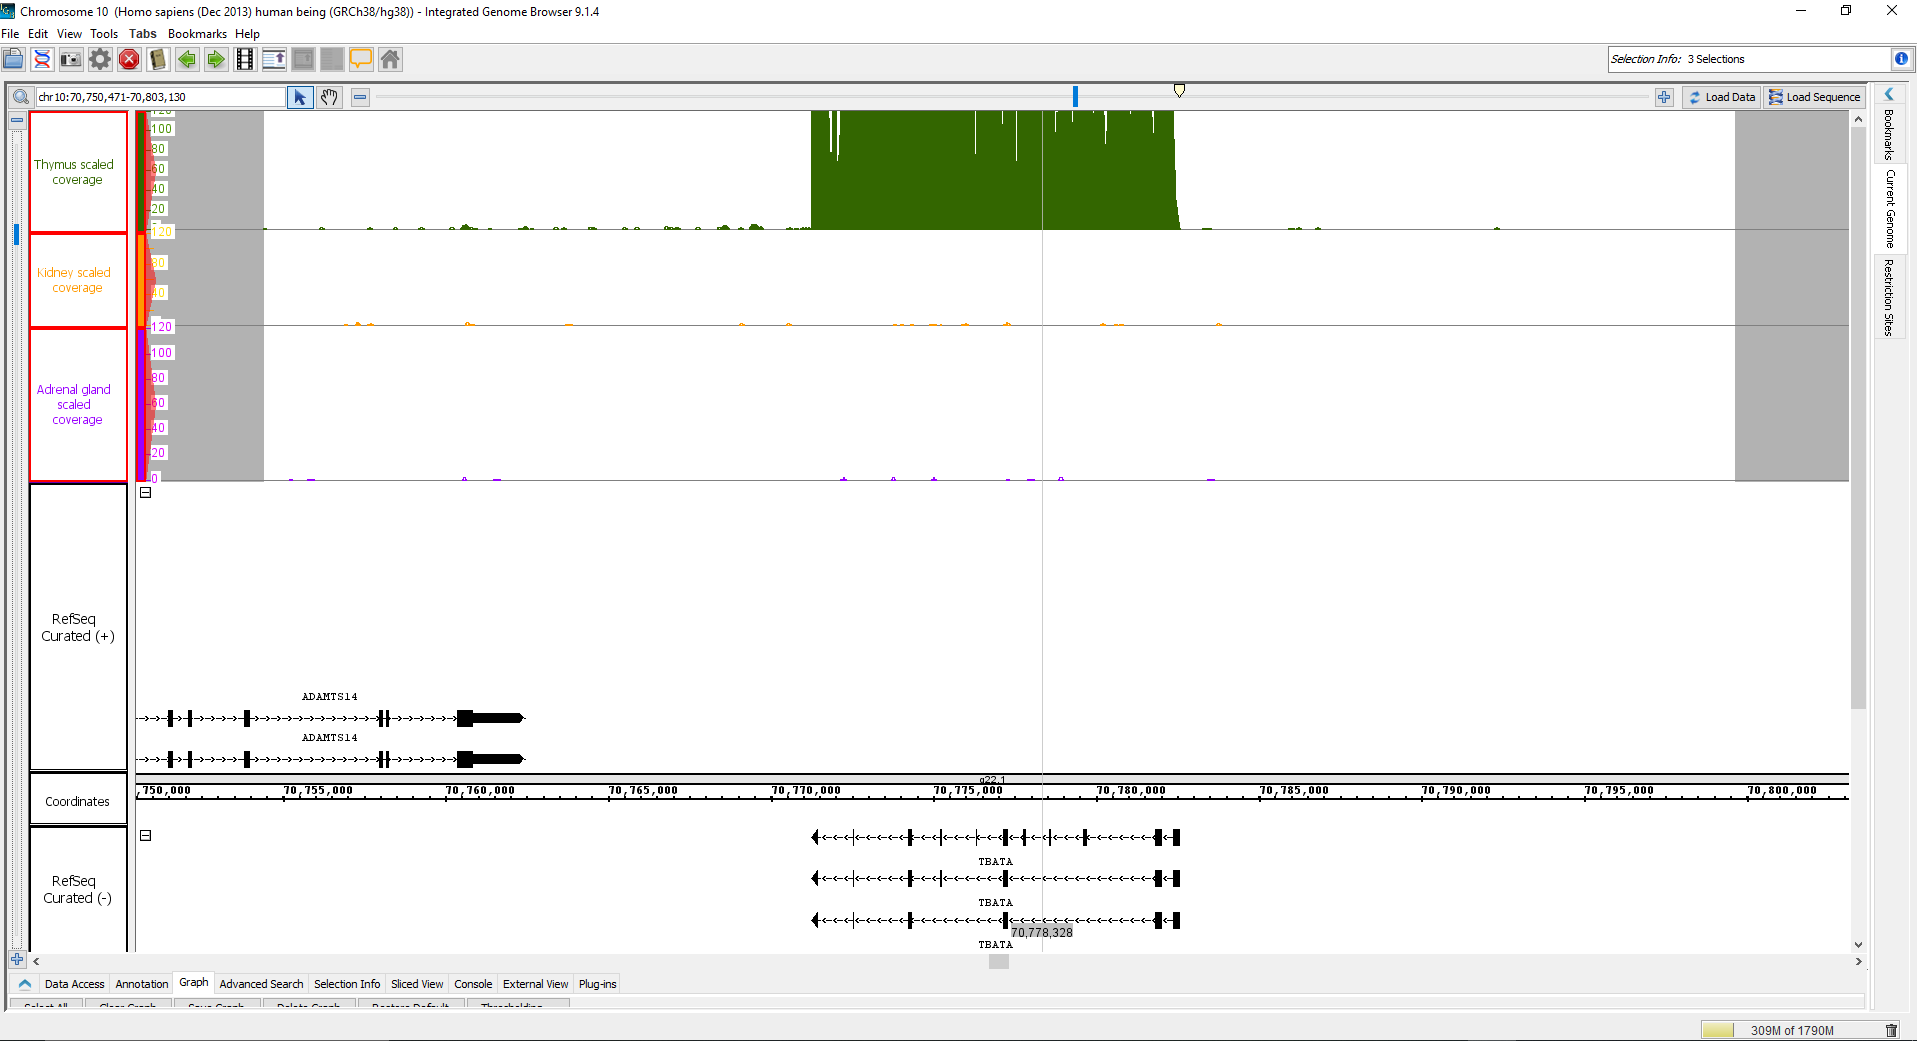
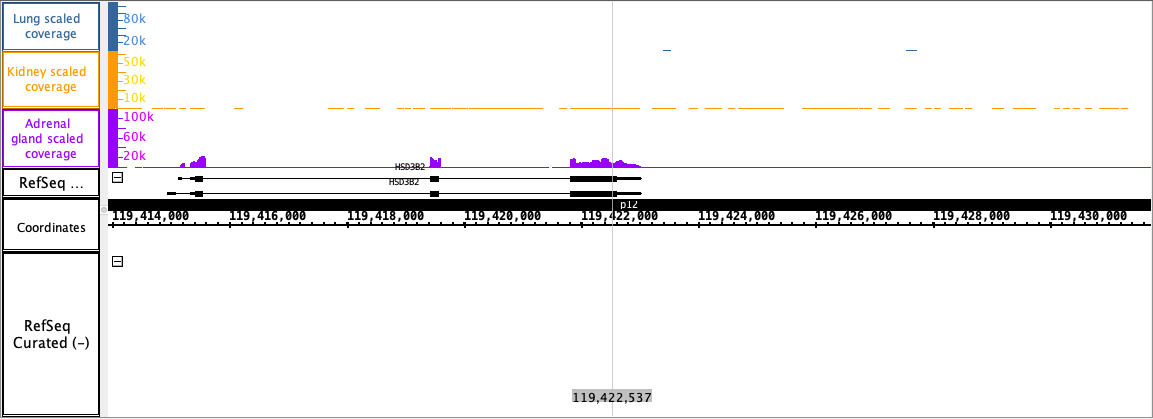
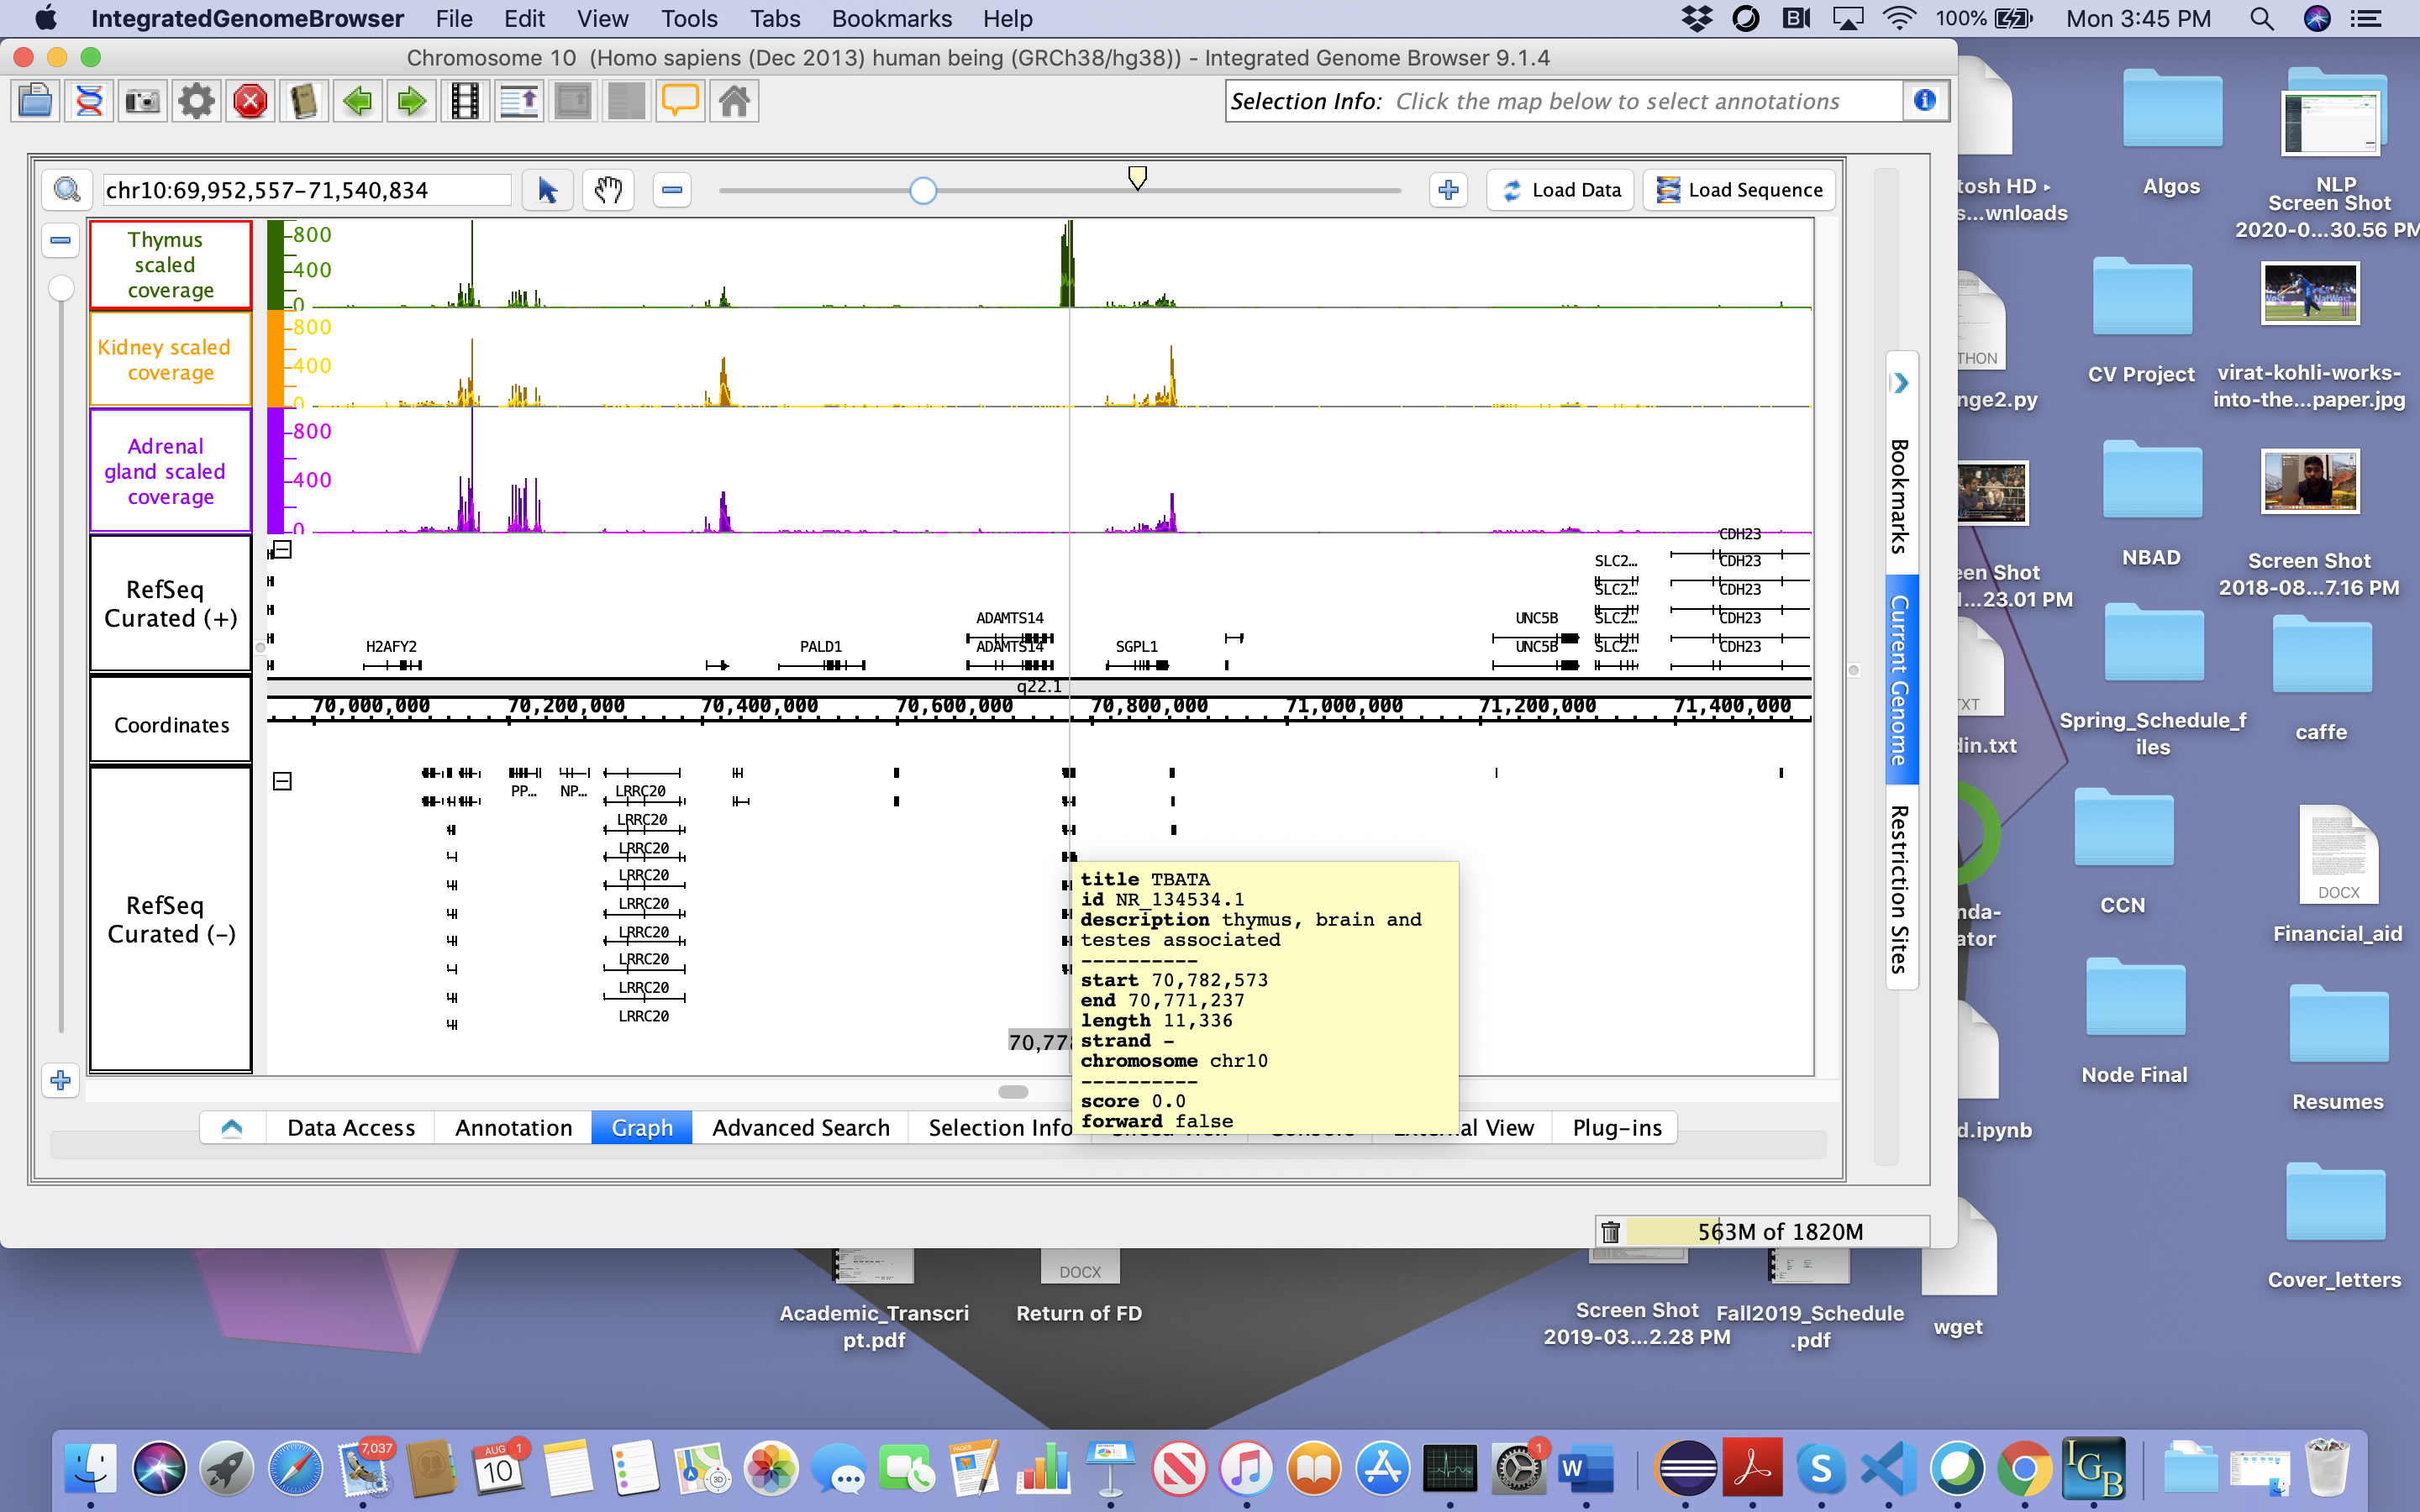
Scope increase: Please identify another gene that is also differentially expressed. The difference should be equally obvious to the eye - e.g., a high peak in one scaled graph low peak in one or more other scaled graphs. (Use graphs from the "scale graph coverage" folder because these have been normalized to account for experimental variation.)
Request 2:
One goal of IGB as a visualization tool is to make it easier for scientists to create illustrations that tell stories about their data, and also show enough information to convince the viewer that the story is correct.
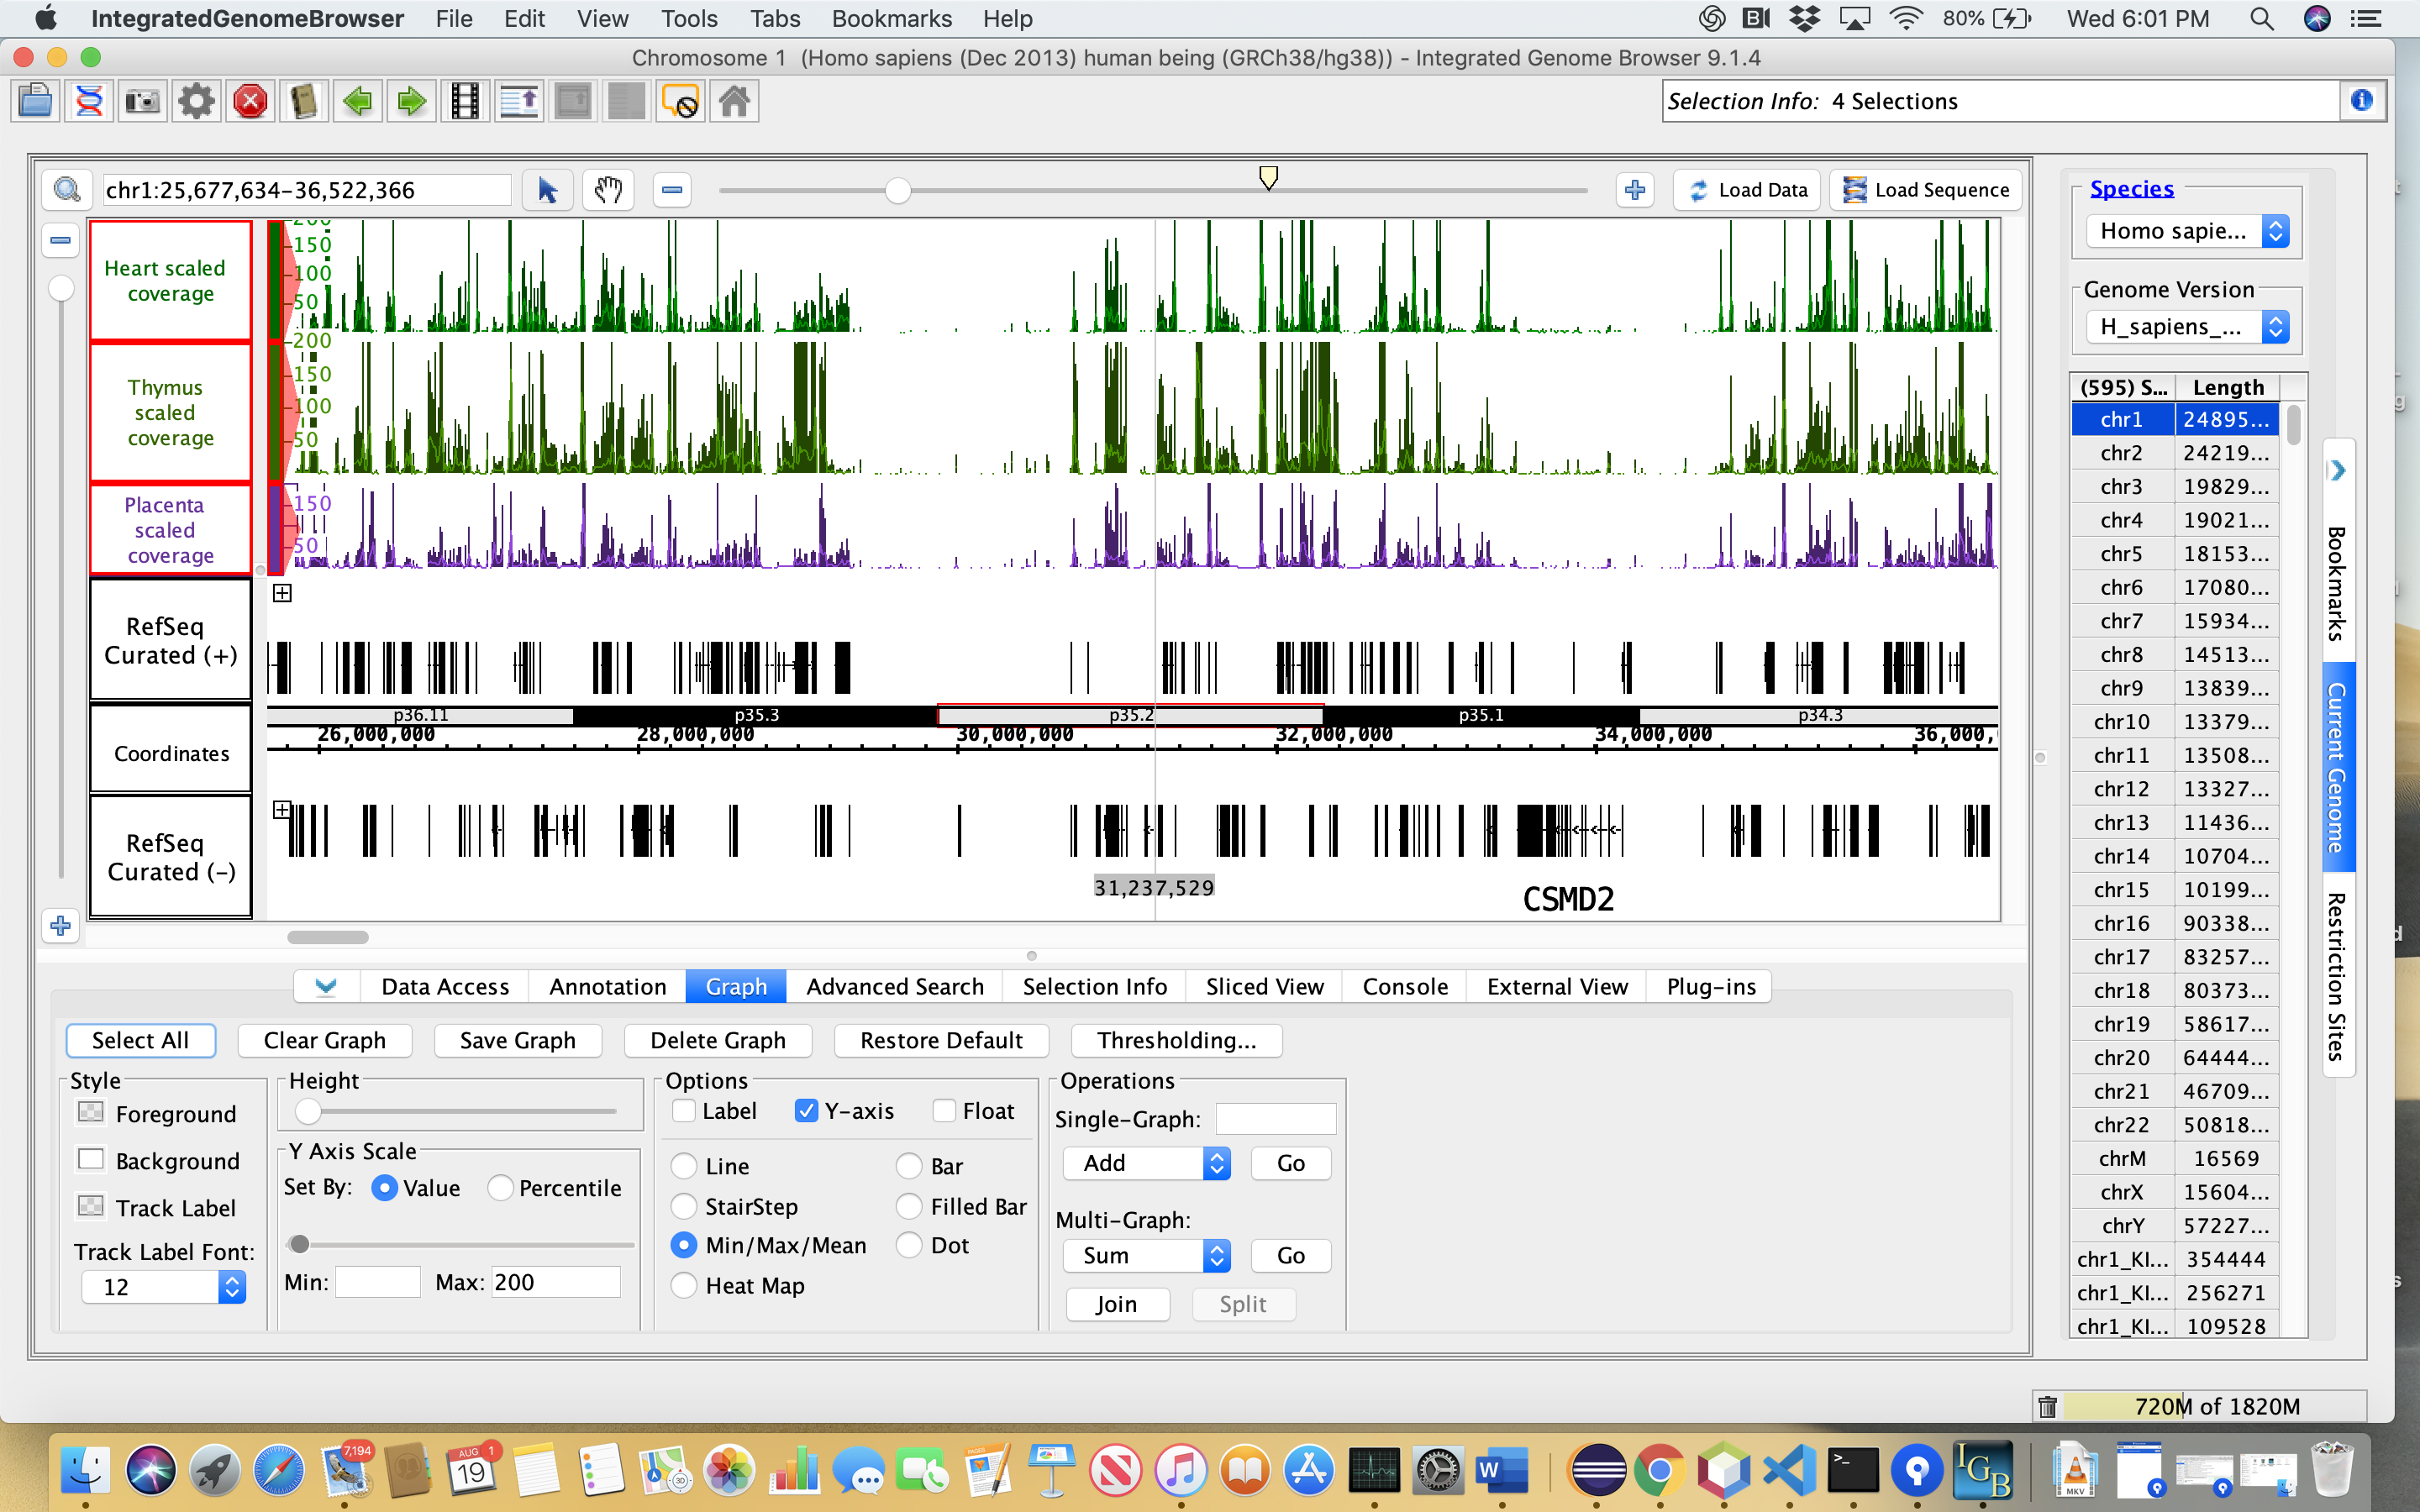
I have a follow-up request:
Can you adjust the graph scales so that all three graphs have the same minimum and maximum settings?
Can you also pick a maximum setting (for all three graphs) that lets us see more detail in the graph above the gene you found - peaks, valleys, etc?
If you realize the gene does not fit the criterion, don't worry about it - stick with the same gene. A major goal for doing this is for you to get experience with using IGB so that you can better write code for the scientists using IGB, and to experience the scientific process and steps they go through.