Details
-
Type:
Task
-
Status: Closed (View Workflow)
-
Priority:
 Major
Major
-
Resolution: Done
-
Affects Version/s: None
-
Fix Version/s: None
-
Labels:None
-
Story Points:1
-
Epic Link:
-
Sprint:Summer 1 2021 Jun 14 - Jun 25, Summer 2 2021 Jun 28 - Jul 9, Summer 3 2021 Jul 12 - Jul 23
Description
Using spreadsheet provided by collaborator, create BED file that allows visualization based on score and/or other characteristics to highlight how the design affects results.
Attachments
Activity
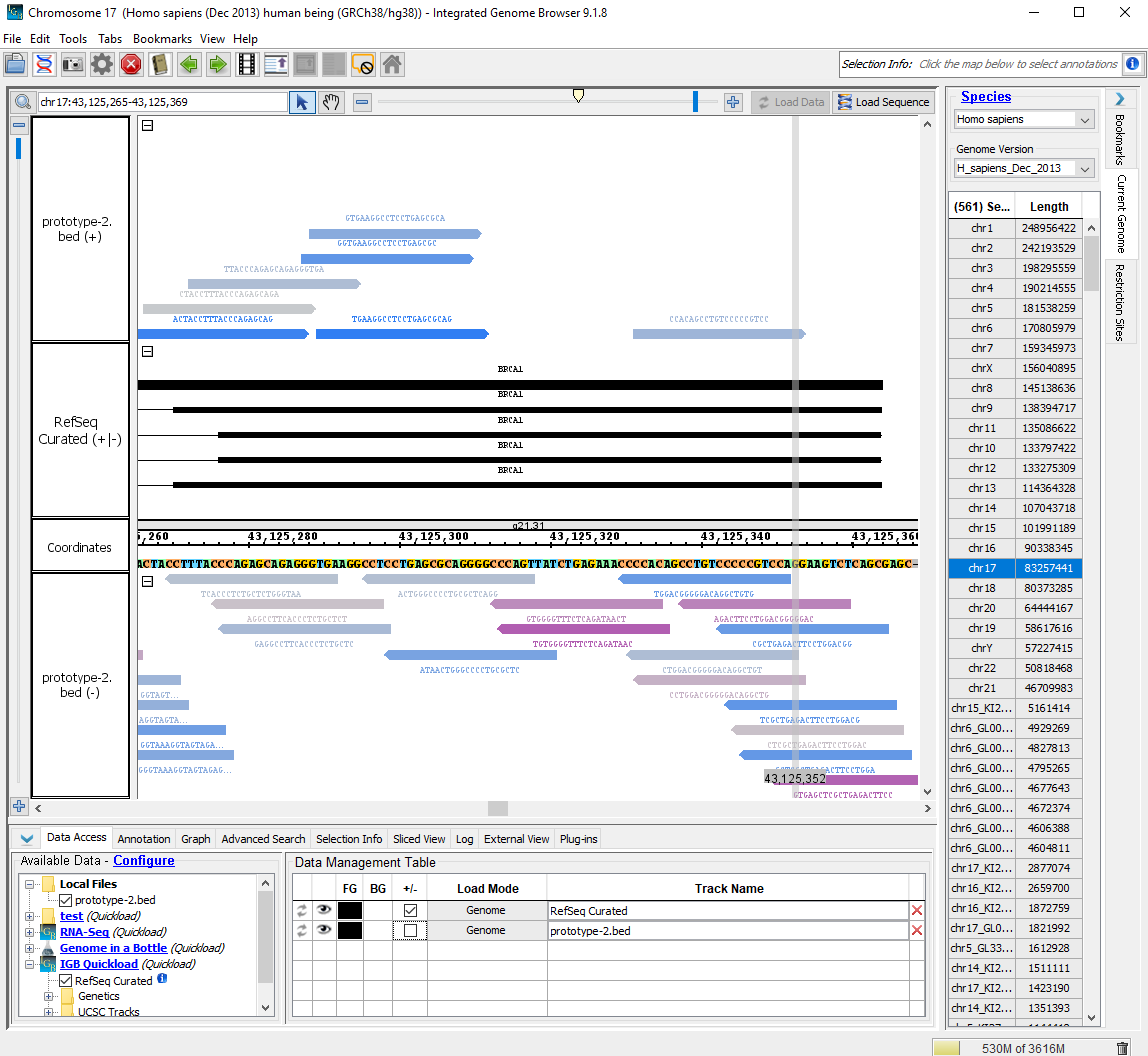
Prototype 2
Prototype 2 is very similar to prototype 1 but with the removal of the columns 7,8,9.
I have also simplified the name column to only contain the sequence of the CRISPR target. This looks more visually appealing to me though it does not contain the PAM site info.
Pros: The file is reduced in size by nearly half.
Cons: I had a hard time getting the Color by... Score to provide colors that accurately depicted differences in the score values. The default range in IGB was too large and needed to be altered, and I needed to add multiple handles to get a gradient that worked well. It would be much easier for a user to just use the RGB values instead. However, IGB does not currently use the track header for itemRgb (DB-64).
The Color by... Score in the Prototype 2 image can be replicated using the following settings:
Handle: Attribute Value = 78, RGB = 0, 51, 255
Handle: Attribute Value = 39, RGB = 204, 204, 204
Handle: Attribute Value = 1, RGB = 204, 0, 204
Thank you for the prototype bed files. Moving to Done.
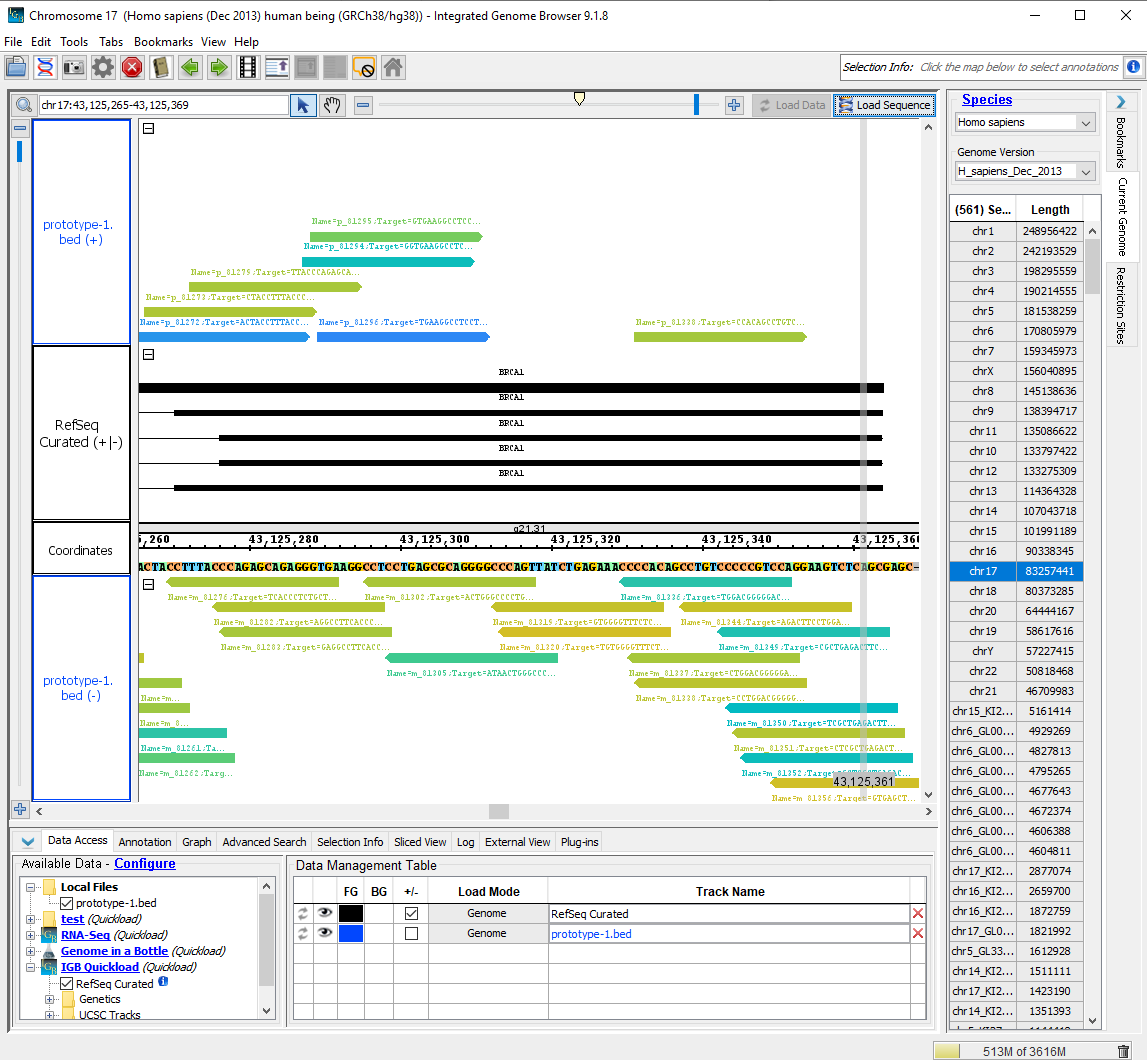
Prototype 1
This idea is based on the output from CRISPRon.
To view the prototype-1.bed file in IGB:
Open the human genome in IGB (H_sapiens_Dec_2013)
Navigate to chr17:43,125,265-43,125,369
Load the prototype-1.bed file and click Load Data
Right-click on the track label for prototype-1.bed and select Color by...
In the Color By window, select RGB in the dropdown menu and click OK
Pros: The bed file includes multiple pieces of data in the Name column, which decreases the size of the file compared to using bedDetail while still including necessary information such as the CRISPR target id, sequence, and PAM site. The RGB value could equate to the score for that particular CRISPR target, and thus using IGB's Color by... functionality allows for fast visual analysis of which CRISPR targets would work best within a particular location.
Cons: Using bedDetail and placing the CRISPR target id in the 13th column and the sequence of the target/PAM site in the 14th column may be more intuitive. Alternatively, only including the six columns (up to strand) would further decrease the file size while still enabling visual analysis by color using Color by... > Score and editing the heatmap (though this requires additional steps for the user, including knowing to set the range of the heatmap to appropriate values.
CRISPRon uses IGV JavaScript to display the results on their webpage. The results can be exported as a bed file. The only difference between the prototype-1.bed file and the CRISPRon output is that the thickStart and thickEnd columns are set to chromStart in the prototype-1.bed file. The initial CRISPRon output had the thickStart match the chromStart and the thickEnd match the chromEnd. This resulted in IGB showing the predicted amino acids as part of the annotation, which I found to distract from the visualization of CRISPR target sites.