Details
-
Type:
Improvement
-
Status: Closed (View Workflow)
-
Priority:
 Major
Major
-
Resolution: Done
-
Affects Version/s: None
-
Fix Version/s: None
-
Labels:None
-
Story Points:1.5
-
Epic Link:
-
Sprint:Fall 9 2021 Dec 13 - Dec 24, Spring 1 2022 Jan 3 - Jan 14, Spring 2 2022 Jan 18 - Jan 28
Description
For this task, deploy data files to a quickload site. Create annots.xml for all the files.
Attachments
Activity
Added code and file "the_colors.txt" needed to use color scheme defined in the repository R code. See new method in Common.R:
# For each value in ExternalDataSets/samples.csv, used to run
# Nextflow's rna-seq pipeline, write out a data sheet mapping
# sample names to hexadecimal color codes, used by makeAnnotsXml.py
# to configure colors for displaying bam, bedgraph, etc. data files
# in IGB
outputColorsForAnnotsXml = function(fname="../ExternalDataSets/the_colors.txt") {
  the_colors = getSampleColors(hex=T)
  df = data.frame(sample=names(the_colors),
                  the_colors=the_colors)
  write.table(df,file=fname,quote=F,sep="\t",row.names = F)
  return(df)
}
Note: there's a weird inconsistency between the header values in the counts data file and the bam files and samples.csv file provided to Nextflow nf-core/rnaseq pipeline. For some reason, the hyphen characters got replaced with period characters in the counts header. I'm not sure why this happened or if it means the files are somehow out of sync with each other.
To test:
- Add this new Quickload site to IGB: http://lorainelab-quickload.scidas.org/hotpollen, call it "Hot Pollen" (or whatever you want)
- Open the latest tomato genome by clicking the tomato image on the IGB home screen
- Observe that the tomato gene models load
- Observe that the Quickload you added appears as a folder in the "Available Data" section of the Data Access panel in IGB
- Open the folder - you should see a subfolder named "ARE PGRP1939255"
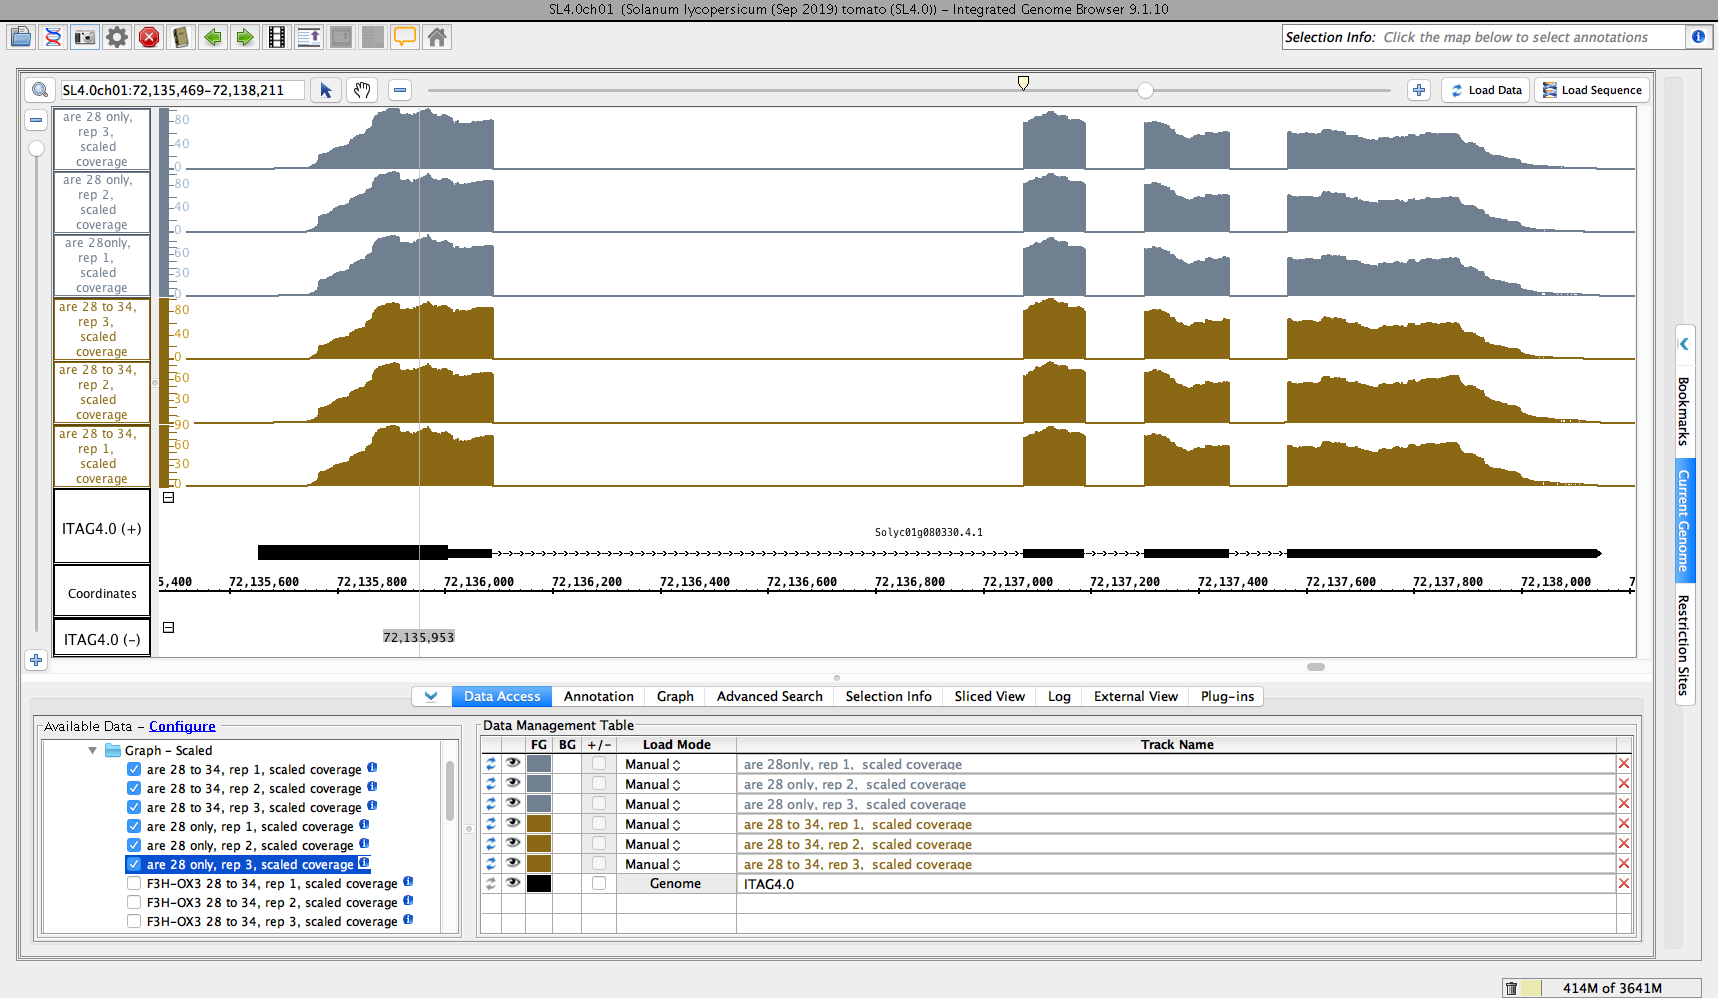
- Open the above folder - you should see two sub-folders called "Reads" and "Graph - Scaled"
- Open the "Reads" folder and check that you can load some data from every data set shown
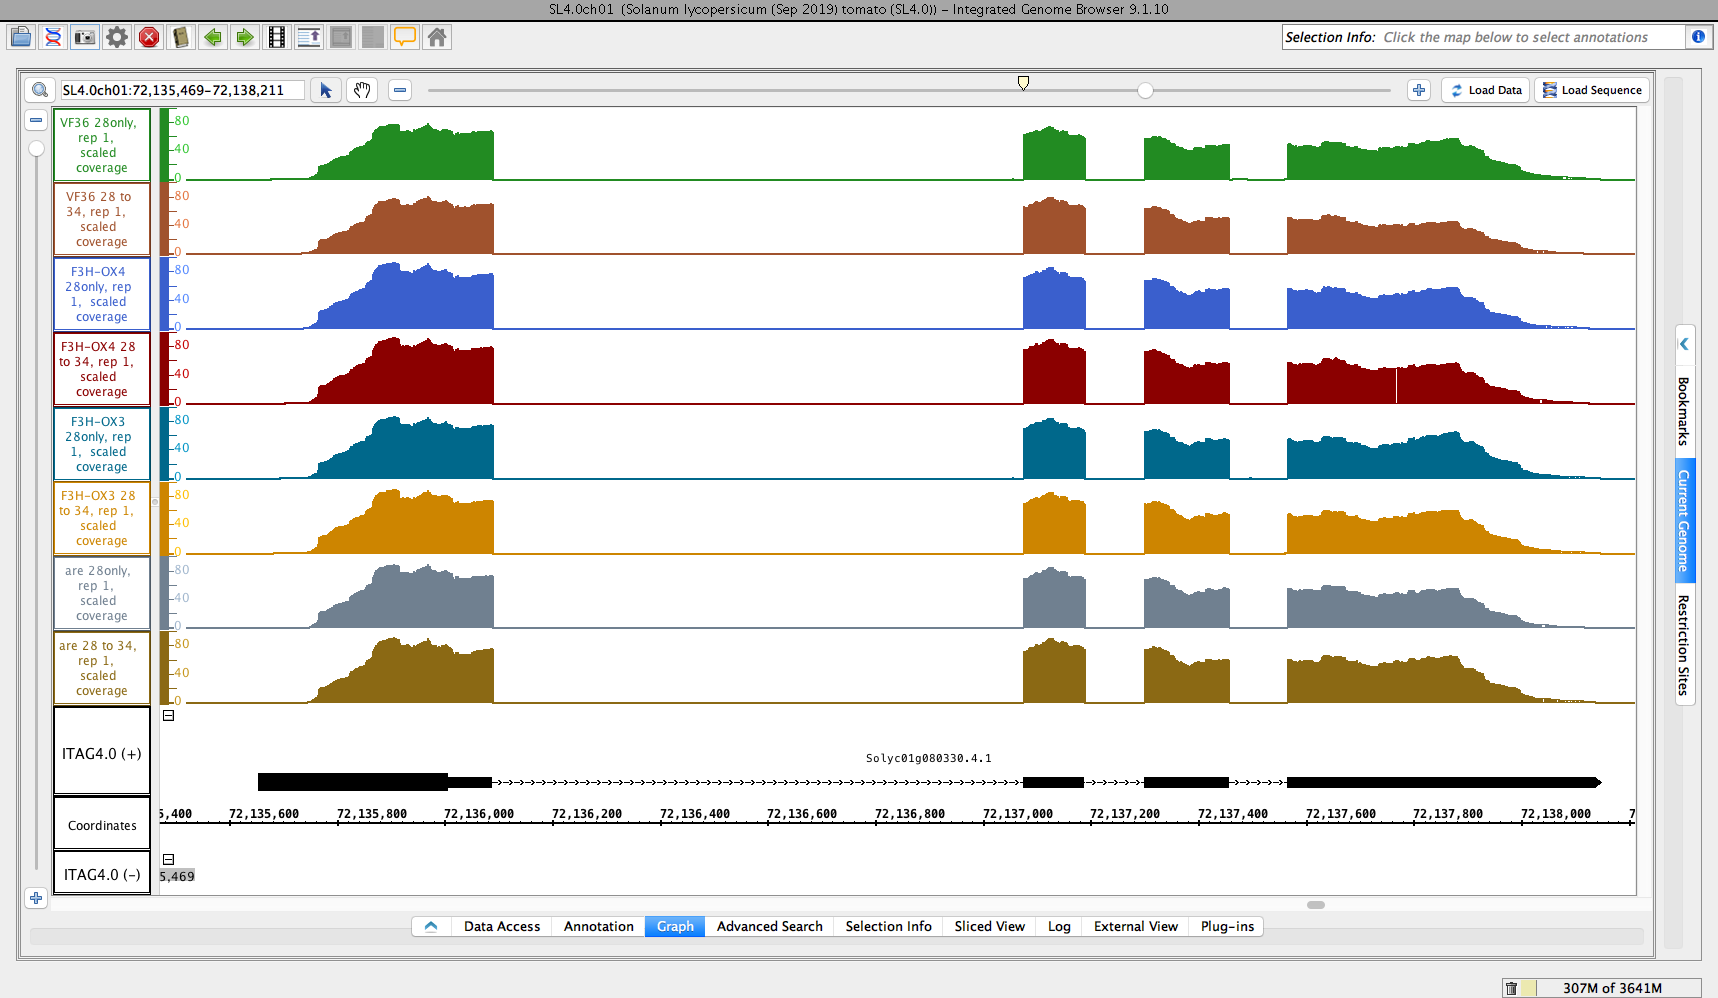
- Open the "Graph -Scaled" folder and check that you can load some data from every data set shown
If the above tests work, then move the ticket to "Done" and re-assign it to [~aloraine].....
Added two files showing scaled coverage graphs.
Test results:
- I added IGB: http://lorainelab-quickload.scidas.org/hotpollen and named it Hot Pollen.
- After opening the data source in IGB, clicking tomato gene, and opening folder and subfolders of the data source, data got loaded as expected.
- Reads and Graphs folder loaded some data of every data set shown.
Closing the ticket.
Copied makeAnnotsXml.py from rna-seq project in "hotpollen" workgroup (bitbucket) into src directory. Need to modify it to work with this project.
Moving back to To-Do for the moment while I work on a couple of other things.