Details
-
Type:
Task
-
Status: Closed (View Workflow)
-
Priority:
 Minor
Minor
-
Resolution: Done
-
Affects Version/s: None
-
Fix Version/s: None
-
Labels:None
-
Story Points:1
-
Epic Link:
-
Sprint:Spring 3 2023 Feb 1
Description
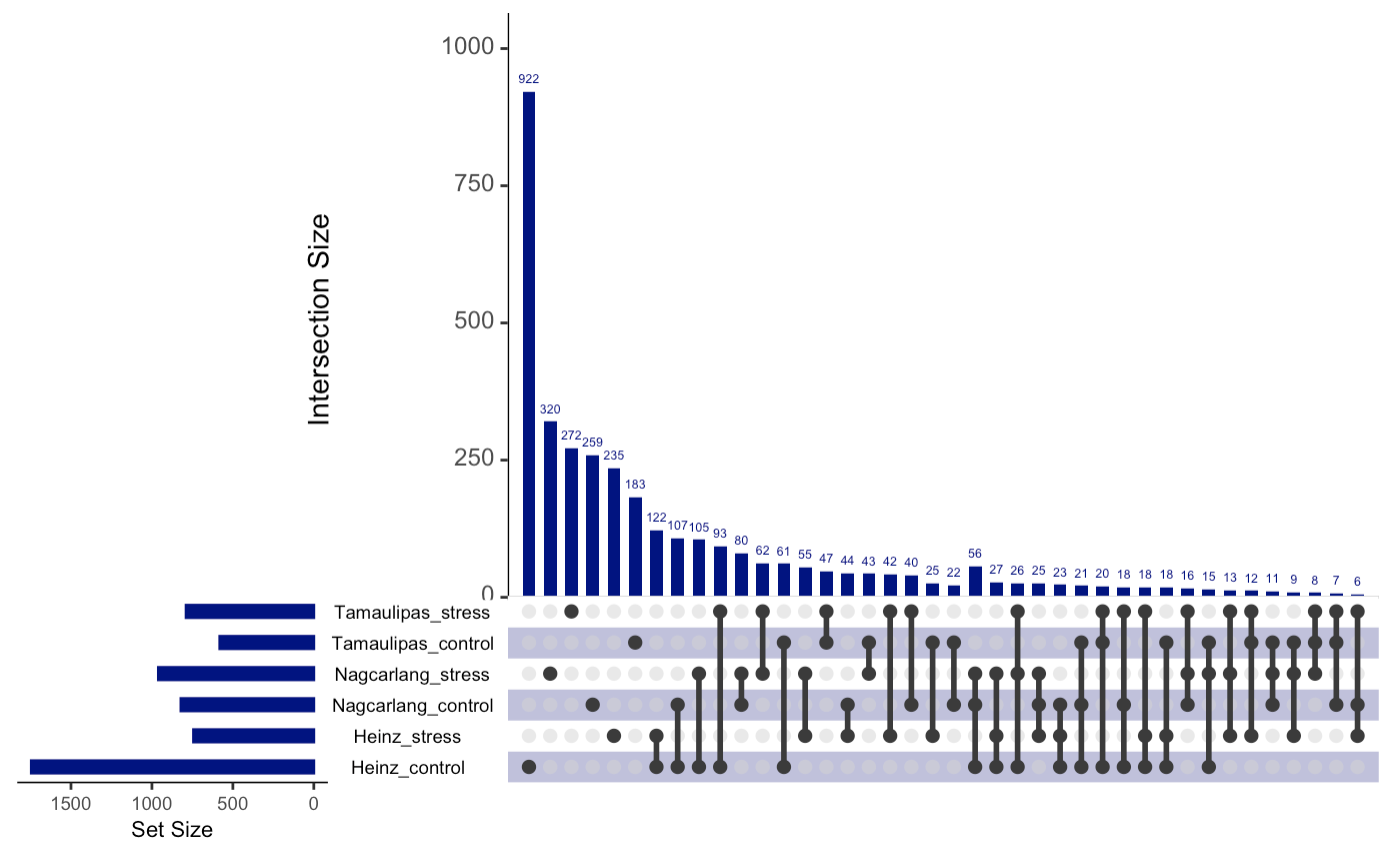
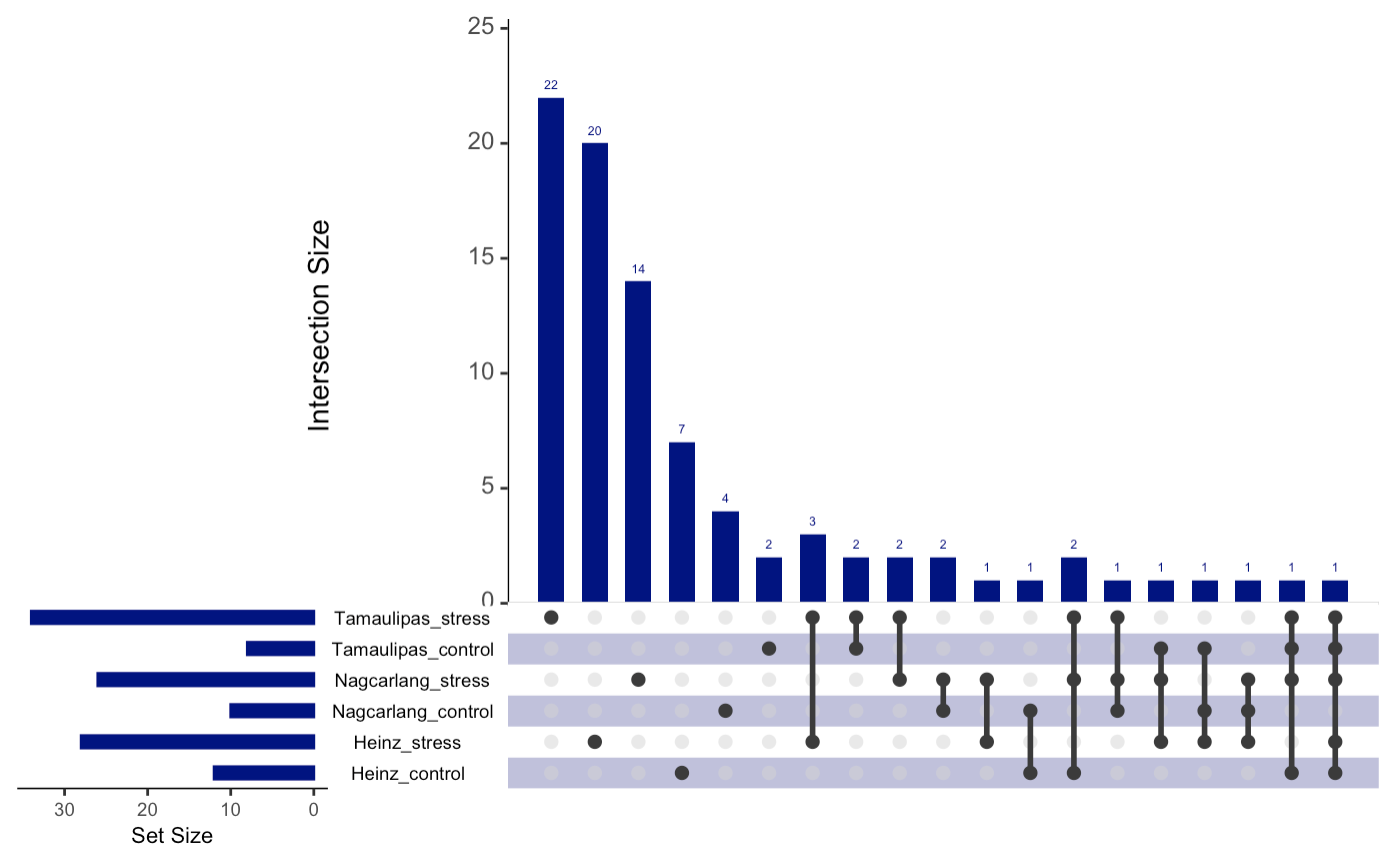
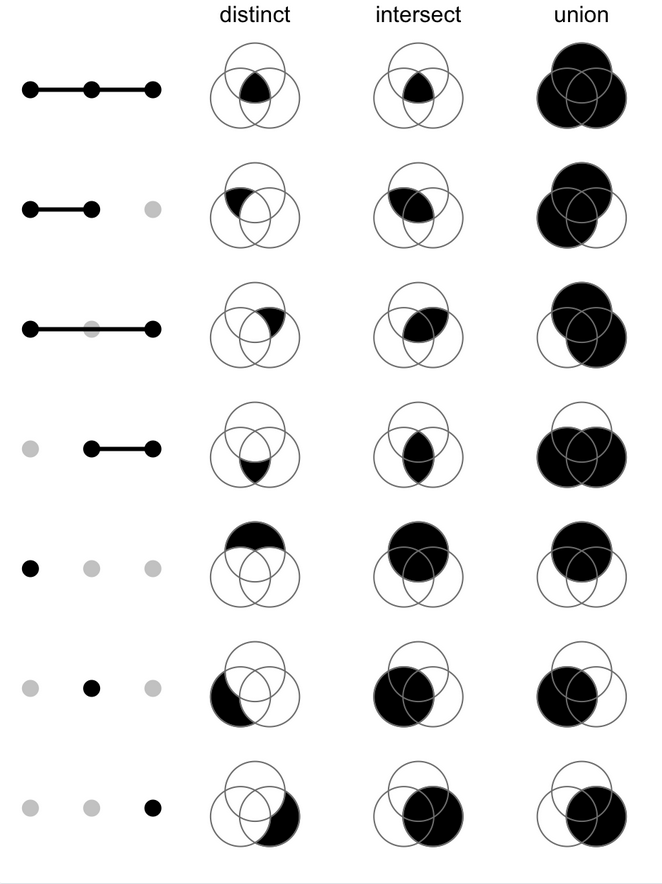
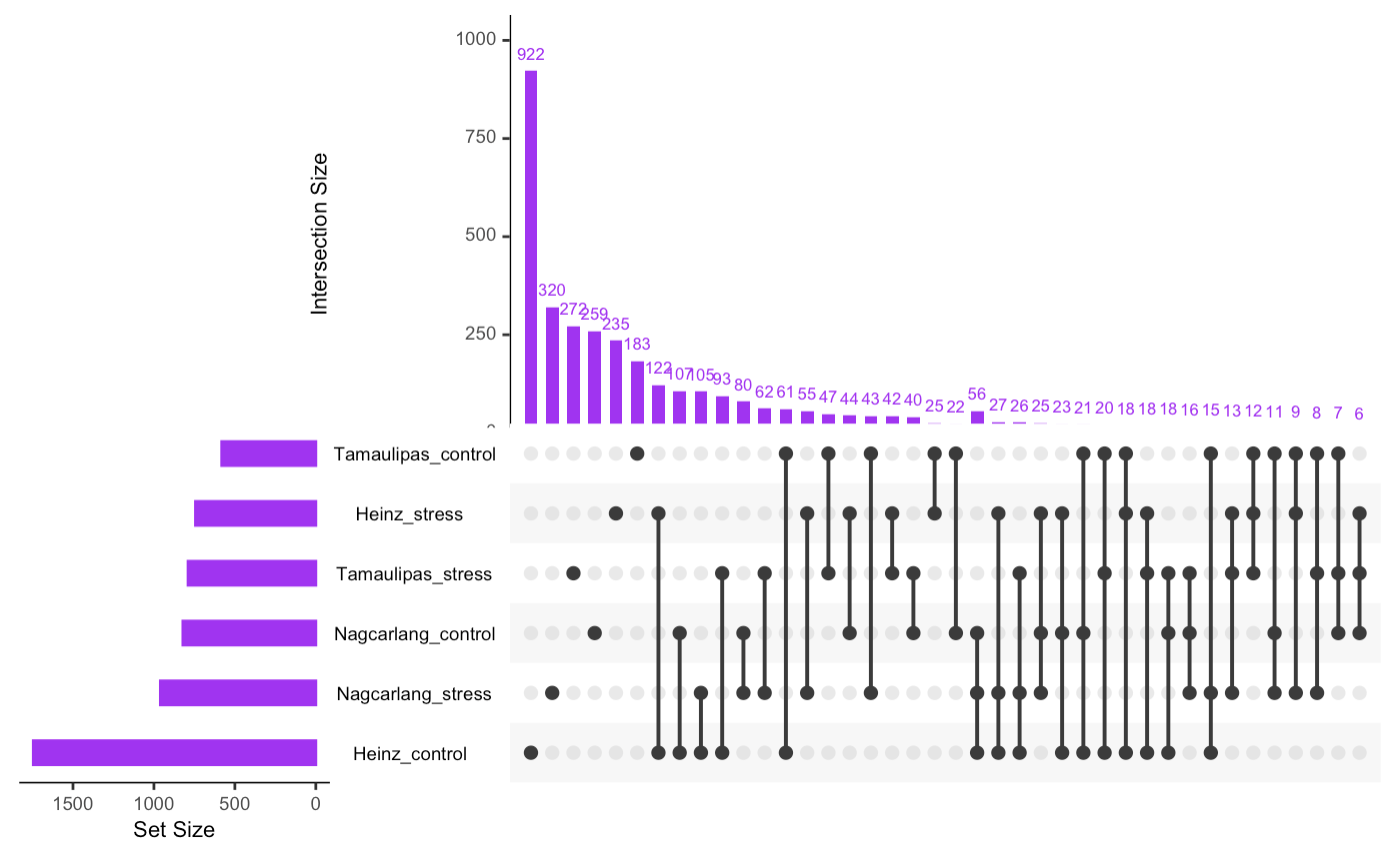
We want to get Venn Diagram like results for the time series data created via EBSeq-HMM.
We wish to use UpsetR for it's fancy visualization.
Example on how to run UpsetR in R:
{{library(UpSetR)
myGeneSets <- list(
set1 = c("gene1","gene2","gene3"),
set2 = c("gene1","gene4","gene5", "gene7"),
set3 = c("gene1","gene7")
)
upset(fromList(myGeneSets))}}
Run this on the Johnson time series data.
A good location for the ebseq data to go , along with these results would be at the following
Google drive location.
Location for the data on Google Drive:
https://drive.google.com/drive/folders/1_I6PLSoBg4H3Y1MzY2qhxjk-FBmM4cmQ?usp=share_link