Details
-
Type:
Task
-
Status: Closed (View Workflow)
-
Priority:
 Major
Major
-
Resolution: Done
-
Affects Version/s: None
-
Fix Version/s: None
-
Labels:None
-
Story Points:0.5
-
Sprint:Fall 4 2023 Oct 16
Description
It's useful to be able to quickly look at a plot showing expression levels for a given gene in a given dataset.
We have some code that does this. It is a function named "makeBarPlot" in Common.R in time course subdirectory of flavonoid rna-seq git repository.
For this task, investigate making an R Shiny app that can maybe do the following:
- uses data files from flavonoid-rnaseq repository
- has an interface where user enters a gene name (with useful preset default value, e.g., F3H)
- shows barplot for that gene so the user can check that the expression levels make sense given the statistical results, and vice versa
Implementation suggestions:
- Save the Shiny App in the repository in a way that makes it easy to deploy
- Reference input datasets via relative paths to "results" folders
- Investigate deploying onto RStudio cloud because it may be crazy easy
Attachments
Issue Links
Activity
| Field | Original Value | New Value |
|---|---|---|
| Epic Link | IGBF-3446 [ 22548 ] |
| Assignee | Ann Loraine [ aloraine ] |
| Sprint | Fall 3 2023 Oct 2 [ 179 ] |
| Status | To-Do [ 10305 ] | In Progress [ 3 ] |
| Status | In Progress [ 3 ] | To-Do [ 10305 ] |
| Comment | [ Putting this into the next sprint for further work. ] |
| Sprint | Fall 3 2023 Oct 2 [ 179 ] | Fall 5 [ 181 ] |
| Sprint | Fall 5 [ 181 ] | Fall 4 2023 Oct 16 [ 180 ] |
| Rank | Ranked higher |
The platform I used to deploy the above Shiny app was a disappointment. It seemed to "go dead" after very short inactivity periods. This made it inconvenient to use the app the way I wanted to.
Before doing anything else on this, I need to know more about deployment possibilities. For example, will users run it locally, in RStudio? Is it realistic to have it "live" on a Web site for many people to use at once?
| Summary | Make Rshiny app that draws barplot for a given gene using data from a dataset | Investigate: Make Rshiny app that draws barplot for a given gene using data from a dataset |
| Status | To-Do [ 10305 ] | In Progress [ 3 ] |
| Description |
It's useful to be able to quickly look at a plot showing expression levels for a given gene in a given dataset.
We have some code that does this. It is a function named "makeBarPlot" in Common.R in time course subdirectory of flavonoid rna-seq git repository. For this task, create a shiny app that lets the user: * select a dataset from this repository (with useful preset default value) * enter a gene name (with useful preset default value, e.g., F3H) * view the barplot for that gene using the existing code Implementation suggestions: * Save the Shiny App in a subdirectory named "apps" to make it easier to find * Reference input datasets via relative paths to "results" folder * Investigate deploying onto RStudio cloud because it may be crazy easy |
It's useful to be able to quickly look at a plot showing expression levels for a given gene in a given dataset.
We have some code that does this. It is a function named "makeBarPlot" in Common.R in time course subdirectory of flavonoid rna-seq git repository. For this task, create a shiny app that lets the user: * select a dataset from this repository (with useful preset default value) * enter a gene name (with useful preset default value, e.g., F3H) * view the barplot for that gene using the existing code Implementation suggestions: * Save the Shiny App in the repository in a way that makes it easy to deploy * Reference input datasets via relative paths to "results" folders * Investigate deploying onto RStudio cloud because it may be crazy easy |
| Comment |
[ I don't think the above code should get committed to the team repository, but I would like to preserve it. Considering uploading to a git hosting service for demonstration purposes.
This should be enough: * Make new branch * Push to my fork * Add link to branch here ] |
| Comment | [ Fork and branch are: ] |
Reviewed the RShiny code Ivory B. created for the Krizek Lab "inducible ant" project, presented in a lecture for BINF 3121.
Code link: https://bitbucket.org/lorainelab/inducible-ant-rna-seq/src/main
To run the app:
1) Clone above onto your local computer.
2) Copy "Samples.txt" to folder named DifferentialExpression (this is needed to correct a configuration error in the repository)
3) Use RStudio to open RStudio project file DifferentialExpression/DifferentialExpression.Rproj.
4) In the RStudio interface, open the folder named "ShowGeneExpression" and open "app.R".
5) Run the by clicking "Run App"
Note you'll need to install a bunch of libraries such as edgeR due to how the Shiny app is structured.
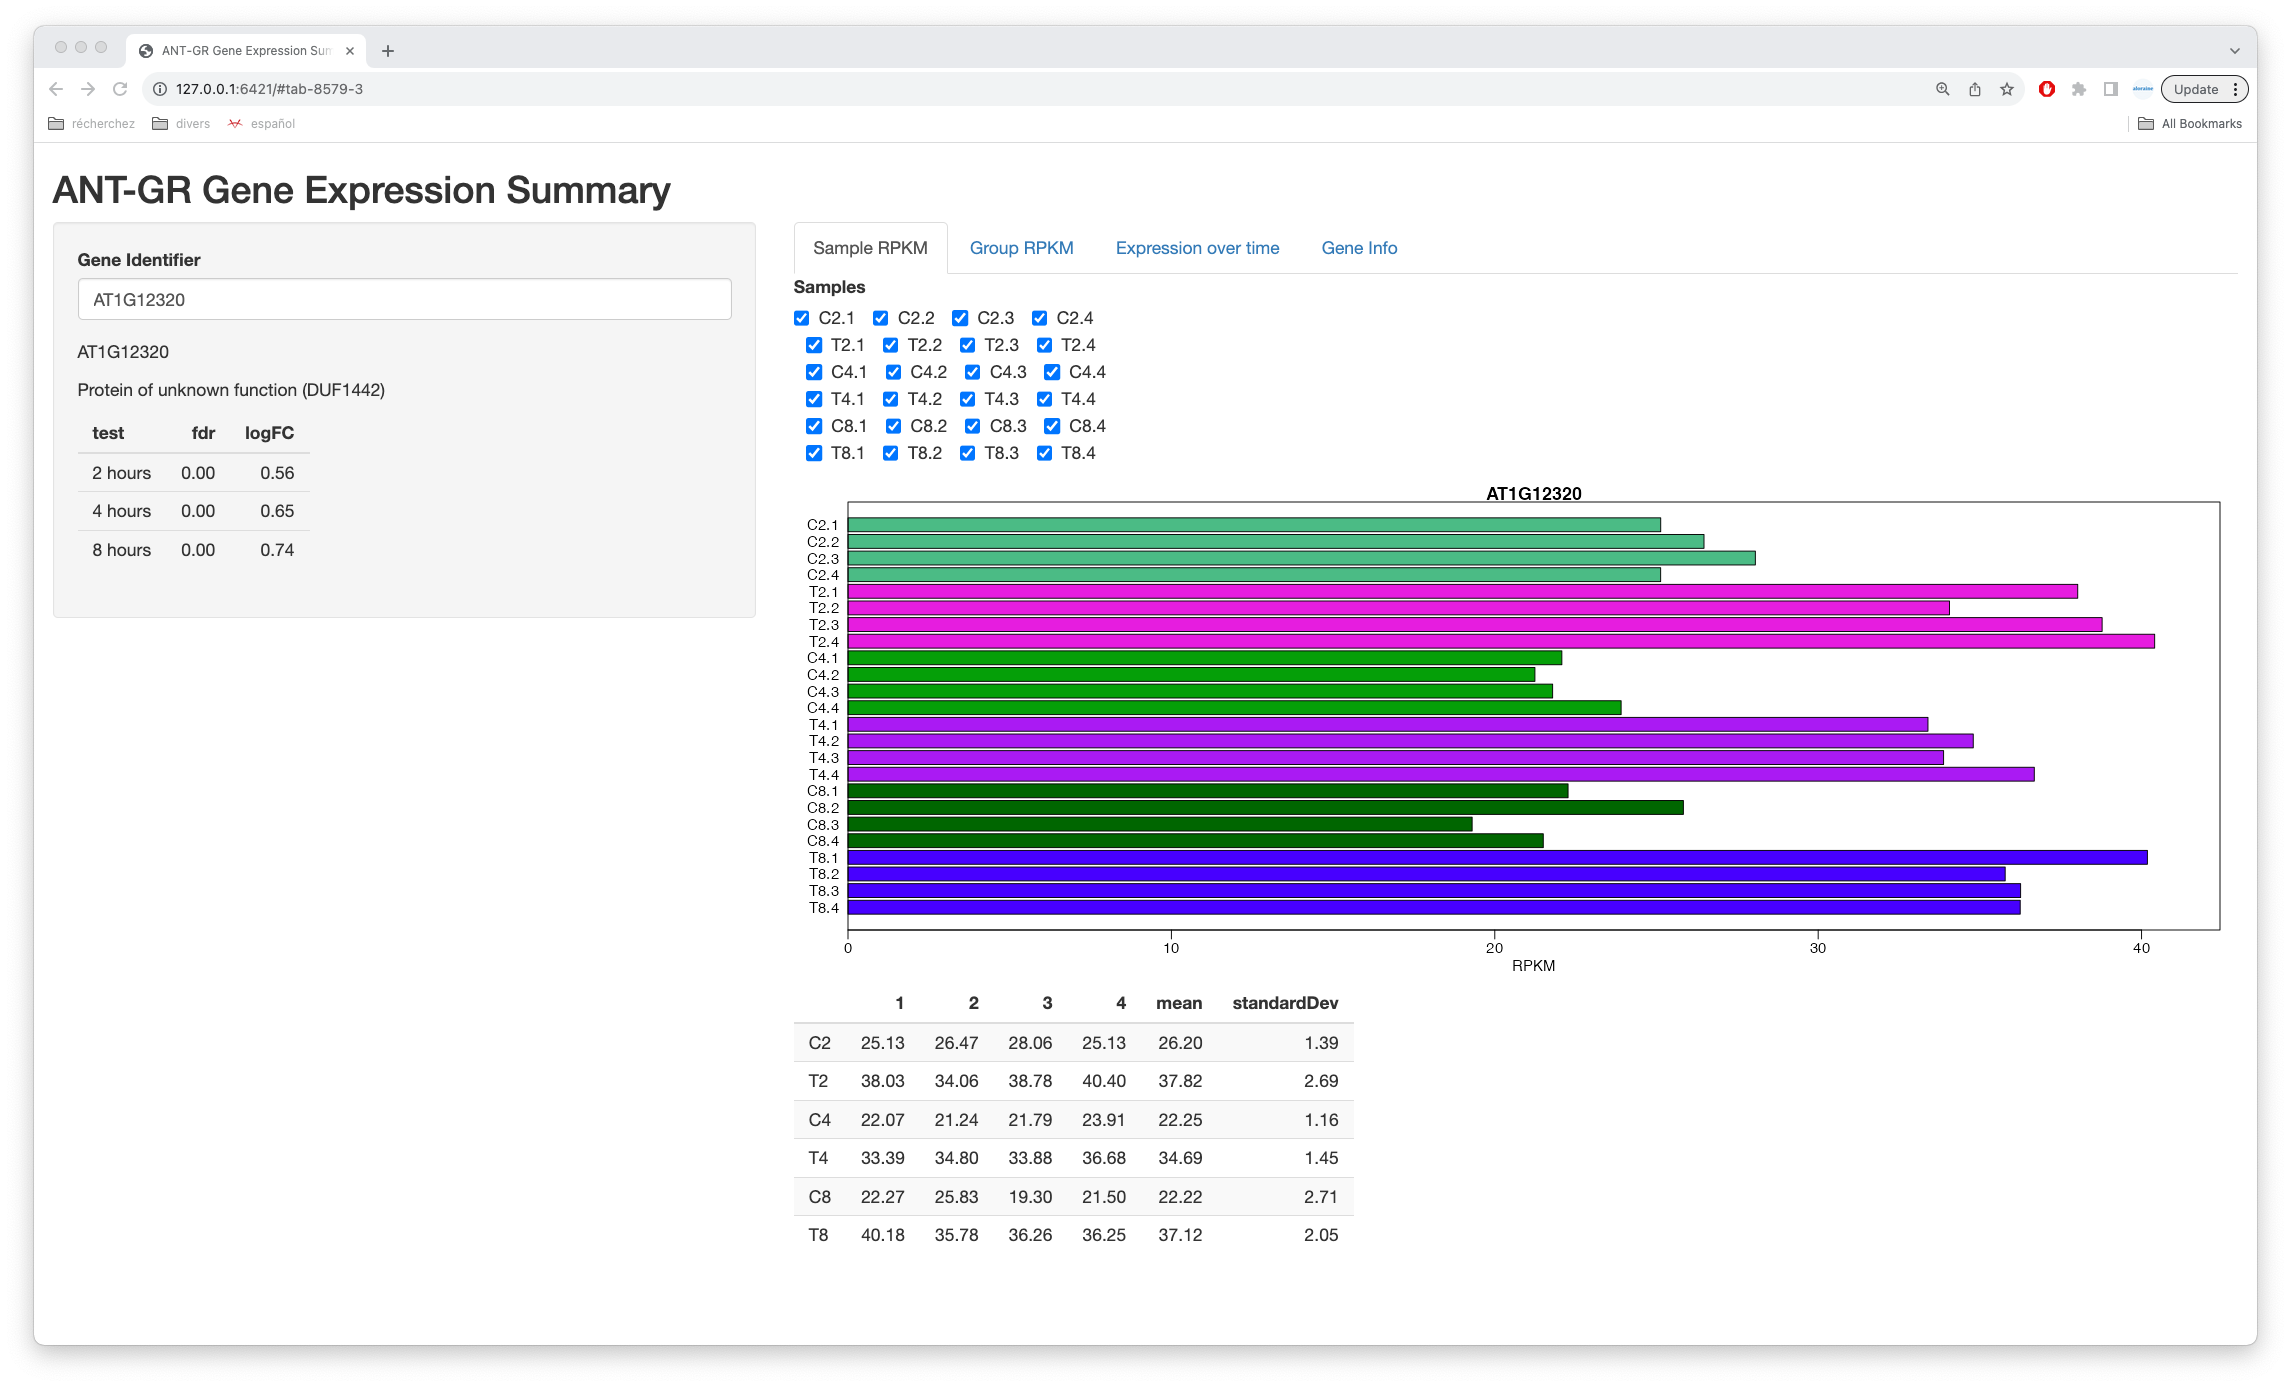
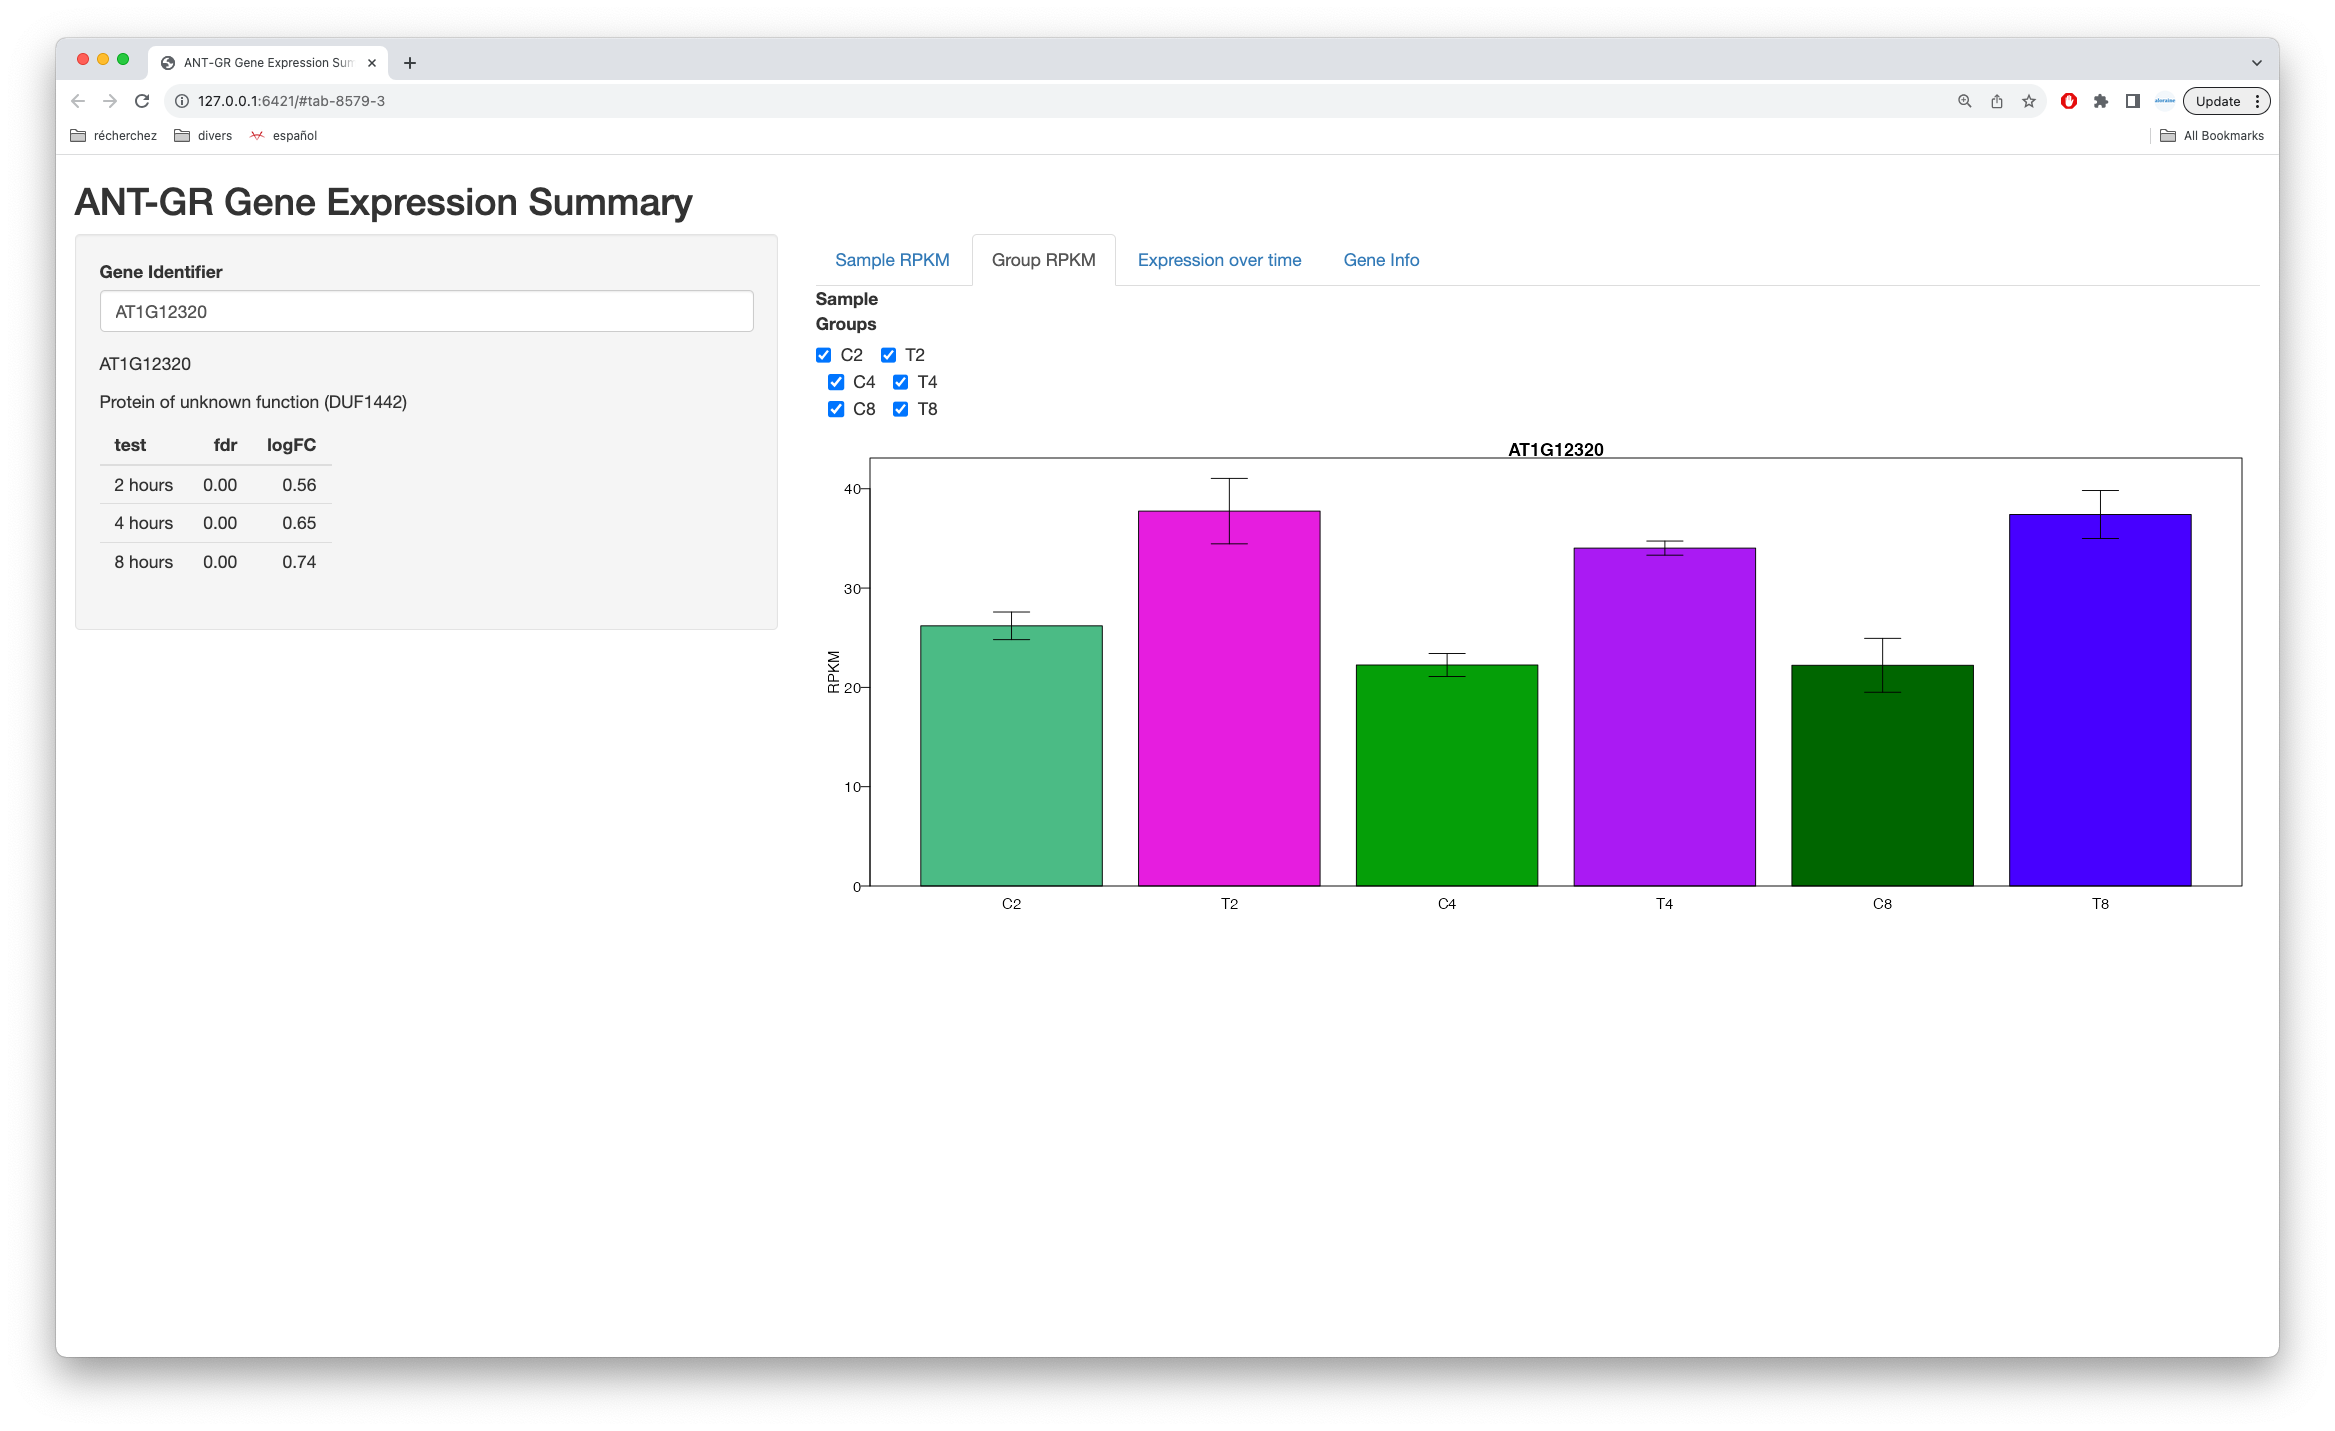
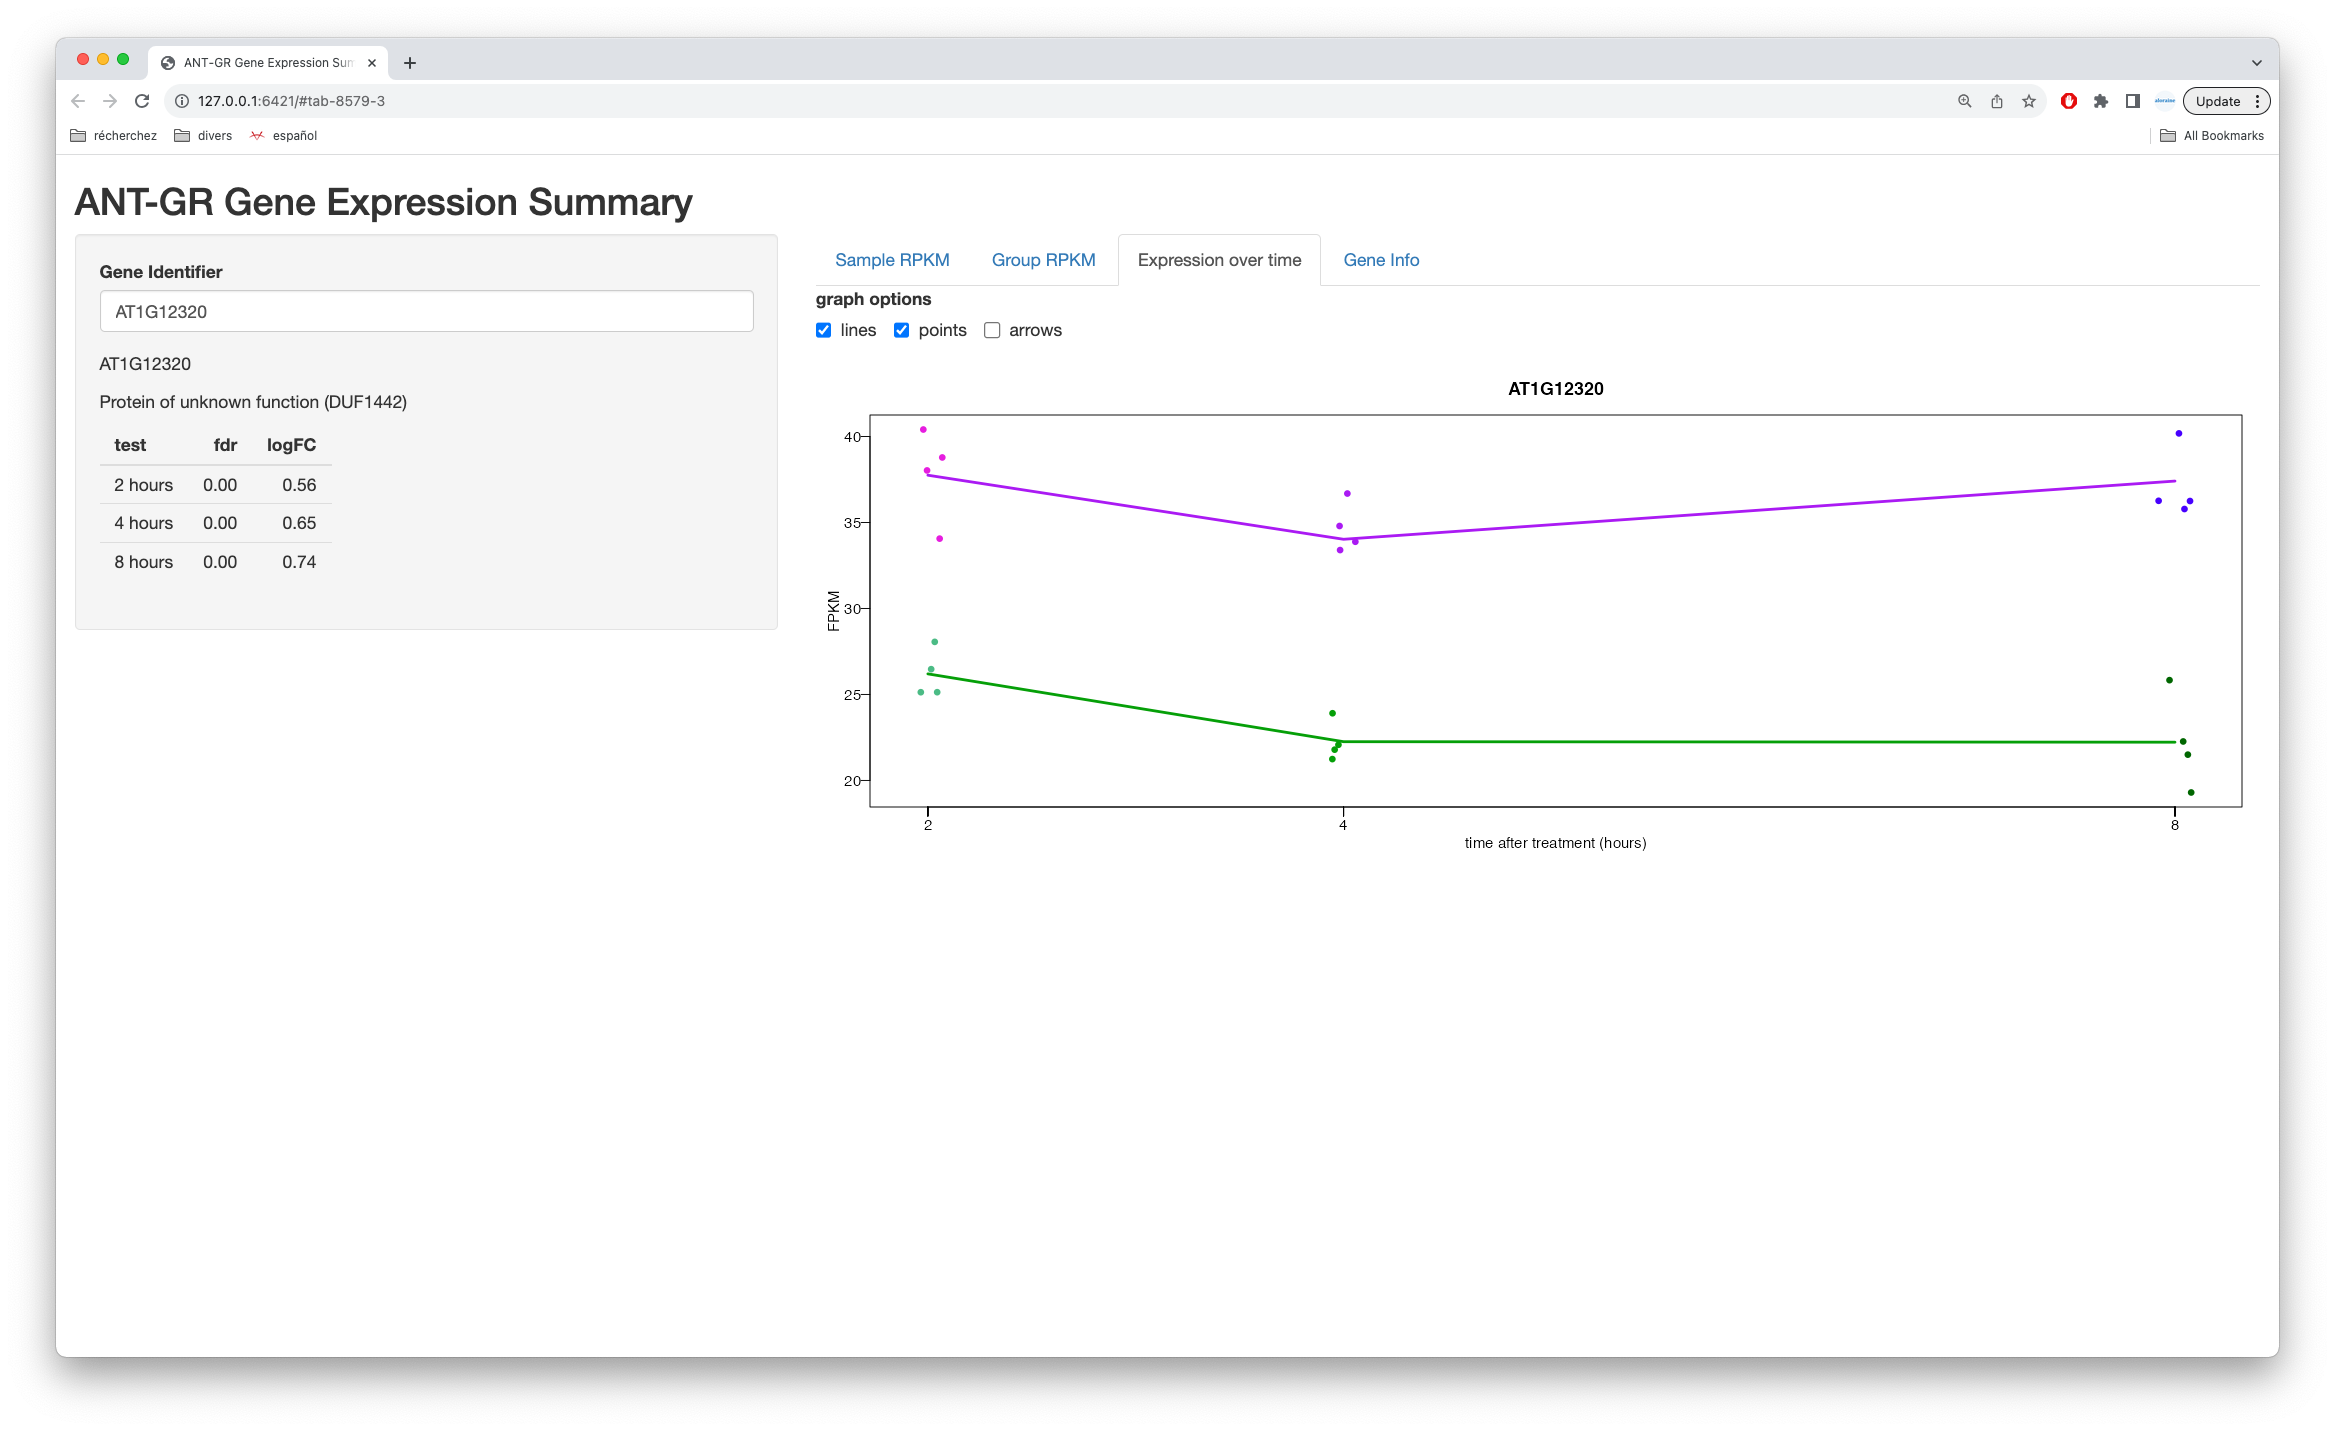
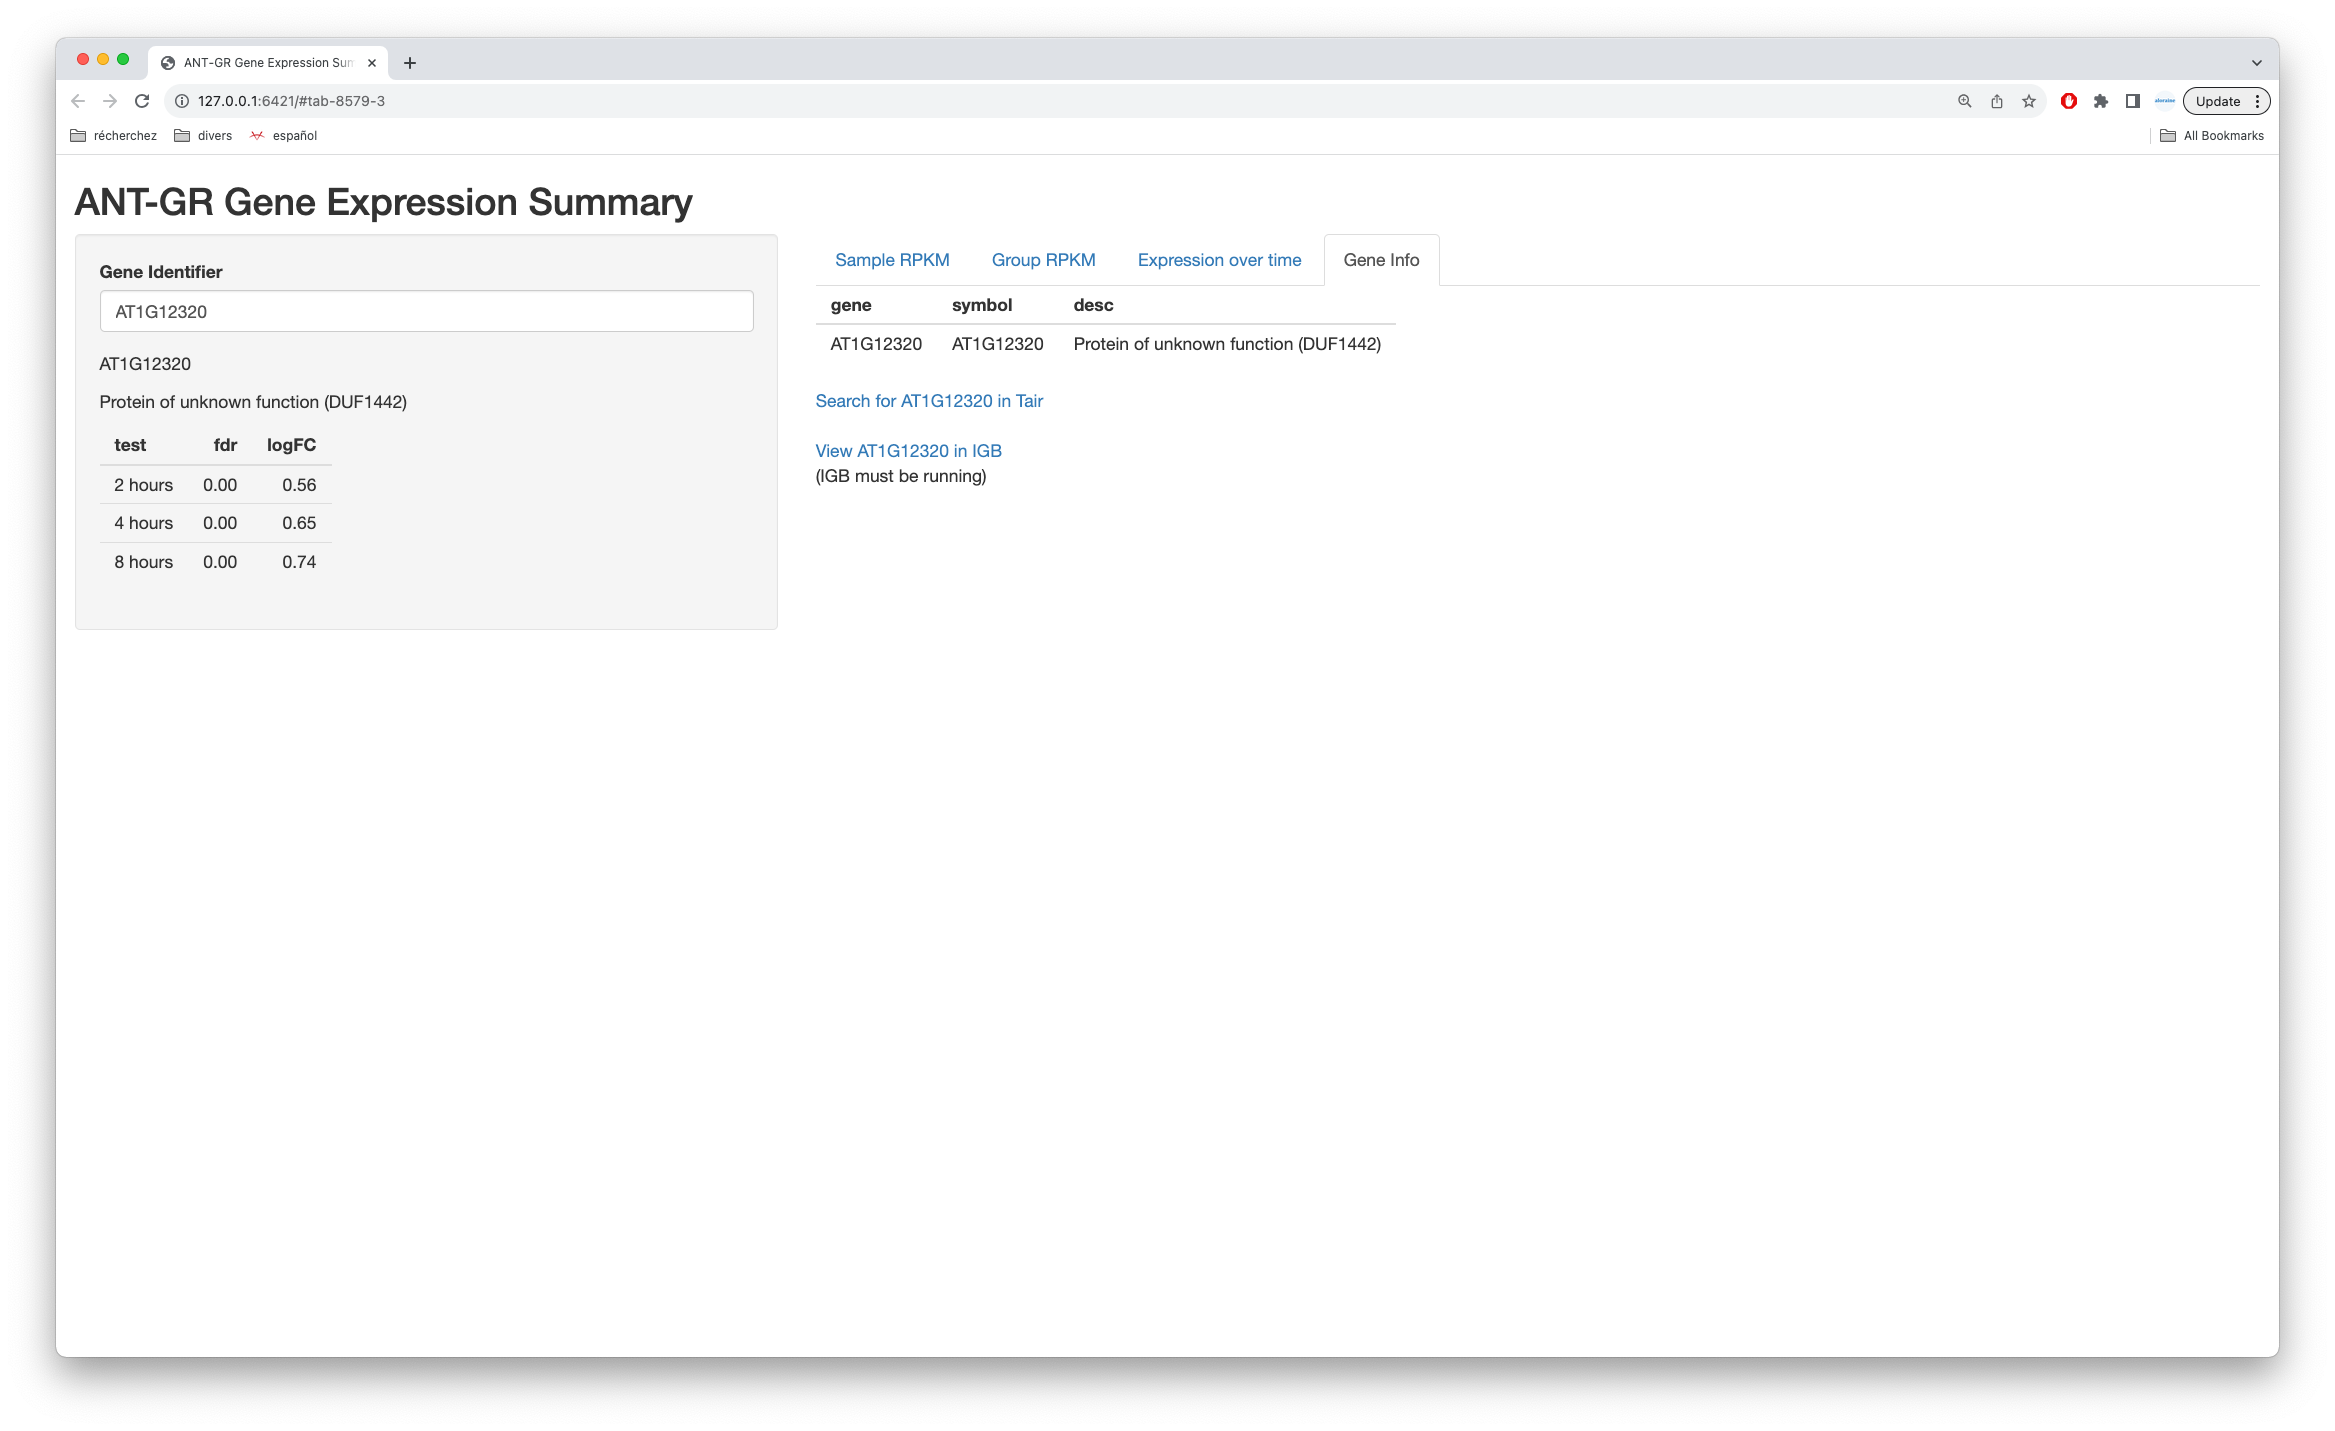
Adding screenshots showing the different parts of the App interface.
Looks like we can indeed create a shiny app that will help Muday lab and others visualize expression of individual genes.
For next steps, let's investigate the code further, to understand how it works and how we need to modify it to use our data and our code.
| Comment |
[ To review / test
* retrieve code for branch * open .Rproj (top-level "project" file) using RStudio desktop * click "Play" * observe user interface components appear functional ] |
| Summary | Investigate: Make Rshiny app that draws barplot for a given gene using data from a dataset | Investigate: Make Rshiny app that plots data for a given gene using data from a dataset |
| Summary | Investigate: Make Rshiny app that plots data for a given gene using data from a dataset | Investigate: Make Rshiny app that plots data for a given gene |
| Assignee | Ann Loraine [ aloraine ] |
| Description |
It's useful to be able to quickly look at a plot showing expression levels for a given gene in a given dataset.
We have some code that does this. It is a function named "makeBarPlot" in Common.R in time course subdirectory of flavonoid rna-seq git repository. For this task, create a shiny app that lets the user: * select a dataset from this repository (with useful preset default value) * enter a gene name (with useful preset default value, e.g., F3H) * view the barplot for that gene using the existing code Implementation suggestions: * Save the Shiny App in the repository in a way that makes it easy to deploy * Reference input datasets via relative paths to "results" folders * Investigate deploying onto RStudio cloud because it may be crazy easy |
It's useful to be able to quickly look at a plot showing expression levels for a given gene in a given dataset.
We have some code that does this. It is a function named "makeBarPlot" in Common.R in time course subdirectory of flavonoid rna-seq git repository. For this task, investigating creating a shiny app that can maybe do the following: * select a dataset from this repository (with useful preset default value) * enter a gene name (with useful preset default value, e.g., F3H) * view the barplot for that gene using the existing code Implementation suggestions: * Save the Shiny App in the repository in a way that makes it easy to deploy * Reference input datasets via relative paths to "results" folders * Investigate deploying onto RStudio cloud because it may be crazy easy |
Conversation today w/ [~aloraine] & [~molly] regarding goals for the app (or apps):
- Needs to be easy to use with minimal input from person using it. They should be able to type in a gene name and not have to worry about what genome assembly the gene is from.
- [~aloraine] requests: First make it work, then make it fast. First make it easy to use and useful, then make it fast and efficient. Make the UI design then implement.
Request for [~molly]: Maybe draw / mock up some designs today. It will be 10x easier and faster to write the code if you have that to start with.
| Assignee | Molly Davis [ molly ] |
| Status | In Progress [ 3 ] | Needs 1st Level Review [ 10005 ] |
| Status | Needs 1st Level Review [ 10005 ] | First Level Review in Progress [ 10301 ] |
| Status | First Level Review in Progress [ 10301 ] | To-Do [ 10305 ] |
| Status | To-Do [ 10305 ] | In Progress [ 3 ] |
| Description |
It's useful to be able to quickly look at a plot showing expression levels for a given gene in a given dataset.
We have some code that does this. It is a function named "makeBarPlot" in Common.R in time course subdirectory of flavonoid rna-seq git repository. For this task, investigating creating a shiny app that can maybe do the following: * select a dataset from this repository (with useful preset default value) * enter a gene name (with useful preset default value, e.g., F3H) * view the barplot for that gene using the existing code Implementation suggestions: * Save the Shiny App in the repository in a way that makes it easy to deploy * Reference input datasets via relative paths to "results" folders * Investigate deploying onto RStudio cloud because it may be crazy easy |
It's useful to be able to quickly look at a plot showing expression levels for a given gene in a given dataset.
We have some code that does this. It is a function named "makeBarPlot" in Common.R in time course subdirectory of flavonoid rna-seq git repository. For this task, investigate making an R Shiny app that can maybe do the following: * uses data files from flavonoid-rnaseq repository * has an interface where user enters a gene name (with useful preset default value, e.g., F3H) * shows barplot for that gene so the user can check that the expression levels make sense given the statistical results, and vice versa Implementation suggestions: * Save the Shiny App in the repository in a way that makes it easy to deploy * Reference input datasets via relative paths to "results" folders * Investigate deploying onto RStudio cloud because it may be crazy easy |
| Status | In Progress [ 3 ] | To-Do [ 10305 ] |
| Status | To-Do [ 10305 ] | In Progress [ 3 ] |
| Status | In Progress [ 3 ] | To-Do [ 10305 ] |
Note: We decided to make a new ticket to capture the remainder of the barplot coding task. That ticket is linked to this one. It is IGBF-3481. Please use that ticket to review the new branch.
Review instructions for the barplot code are there.
For reference, here is the review request comment copied over to the other ticket:
I am pushing a new branch to my fork with my barplot code.
A couple of changes:
- The new code supports both SL4 and SL5.
- I changed the y axis label to include the string "(scaled counts)"
See:
https://bitbucket.org/aloraine/flavonoid-rnaseq/branch/IGBF-3449-1
| Status | To-Do [ 10305 ] | In Progress [ 3 ] |
| Comment | [ *Update*: I have made my own app.R and have been adding each step of Ivory code into the app over time. For example, I have successfully used our results file and was able to adapt the code to show the gene identifier and to check it. I also posted the correct gene name below the user input with an else statement that will give corrections if wrong. Right now I am working on the data.frame in the sidebar under the gene identifier so it works with our results file. ] |
| Comment |
[ *Update since 1st demo*:
* App now includes SL4 and SL5 genes * Includes all experiments in the data frame for user to see * Removed scientific notation * Added note about NA * Having some issues with getting all the data to show up for each experiment with the chosen gene * Currently working on main plots ] |
| Assignee | Molly Davis [ molly ] |
Summary of what we found out:
- We really like using this technology to enable fast and user-friendly visualization of results.
- We have some trouble finding "how-to" information that isn't behind a paywall.
- We need a location that we can truly control and provision with apps. We haven't figured out the deployment strategy yet.
- We like the barplot app for our own purposes of sanity-checking, i.e., it helps see if our analysis is correct.
- However, we're not even sure if anyone else that we've shared the link with is actually using it.
Goals and aspirations:
- Would like it to be used with multiple different data sets from different labs. (from: [~molly])
- Want a more reliable and easy-to-control deployment platform.(from [~aloraine] & [~RobertReid])
- Want to be able to carve up different pieces of the work for others to do. (from [~aloraine])
- Can we figure out a way to save the plots? "There should be a save button."
First phase of investigation complete (because we have more questions, esp. wrt to deployment strategy.)
Moving to DONE.
| Status | In Progress [ 3 ] | Needs 1st Level Review [ 10005 ] |
| Status | Needs 1st Level Review [ 10005 ] | First Level Review in Progress [ 10301 ] |
| Status | First Level Review in Progress [ 10301 ] | Ready for Pull Request [ 10304 ] |
| Status | Ready for Pull Request [ 10304 ] | Pull Request Submitted [ 10101 ] |
| Status | Pull Request Submitted [ 10101 ] | Reviewing Pull Request [ 10303 ] |
| Status | Reviewing Pull Request [ 10303 ] | Merged Needs Testing [ 10002 ] |
| Status | Merged Needs Testing [ 10002 ] | Post-merge Testing In Progress [ 10003 ] |
| Resolution | Done [ 10000 ] | |
| Status | Post-merge Testing In Progress [ 10003 ] | Closed [ 6 ] |
Made a new shiny app and published it, including with results files.
Deployed it here: