Details
-
Type:
Task
-
Status: Closed (View Workflow)
-
Priority:
 Major
Major
-
Resolution: Done
-
Affects Version/s: None
-
Fix Version/s: None
-
Labels:None
-
Story Points:0.5
-
Sprint:Fall 4 2023 Oct 16
Description
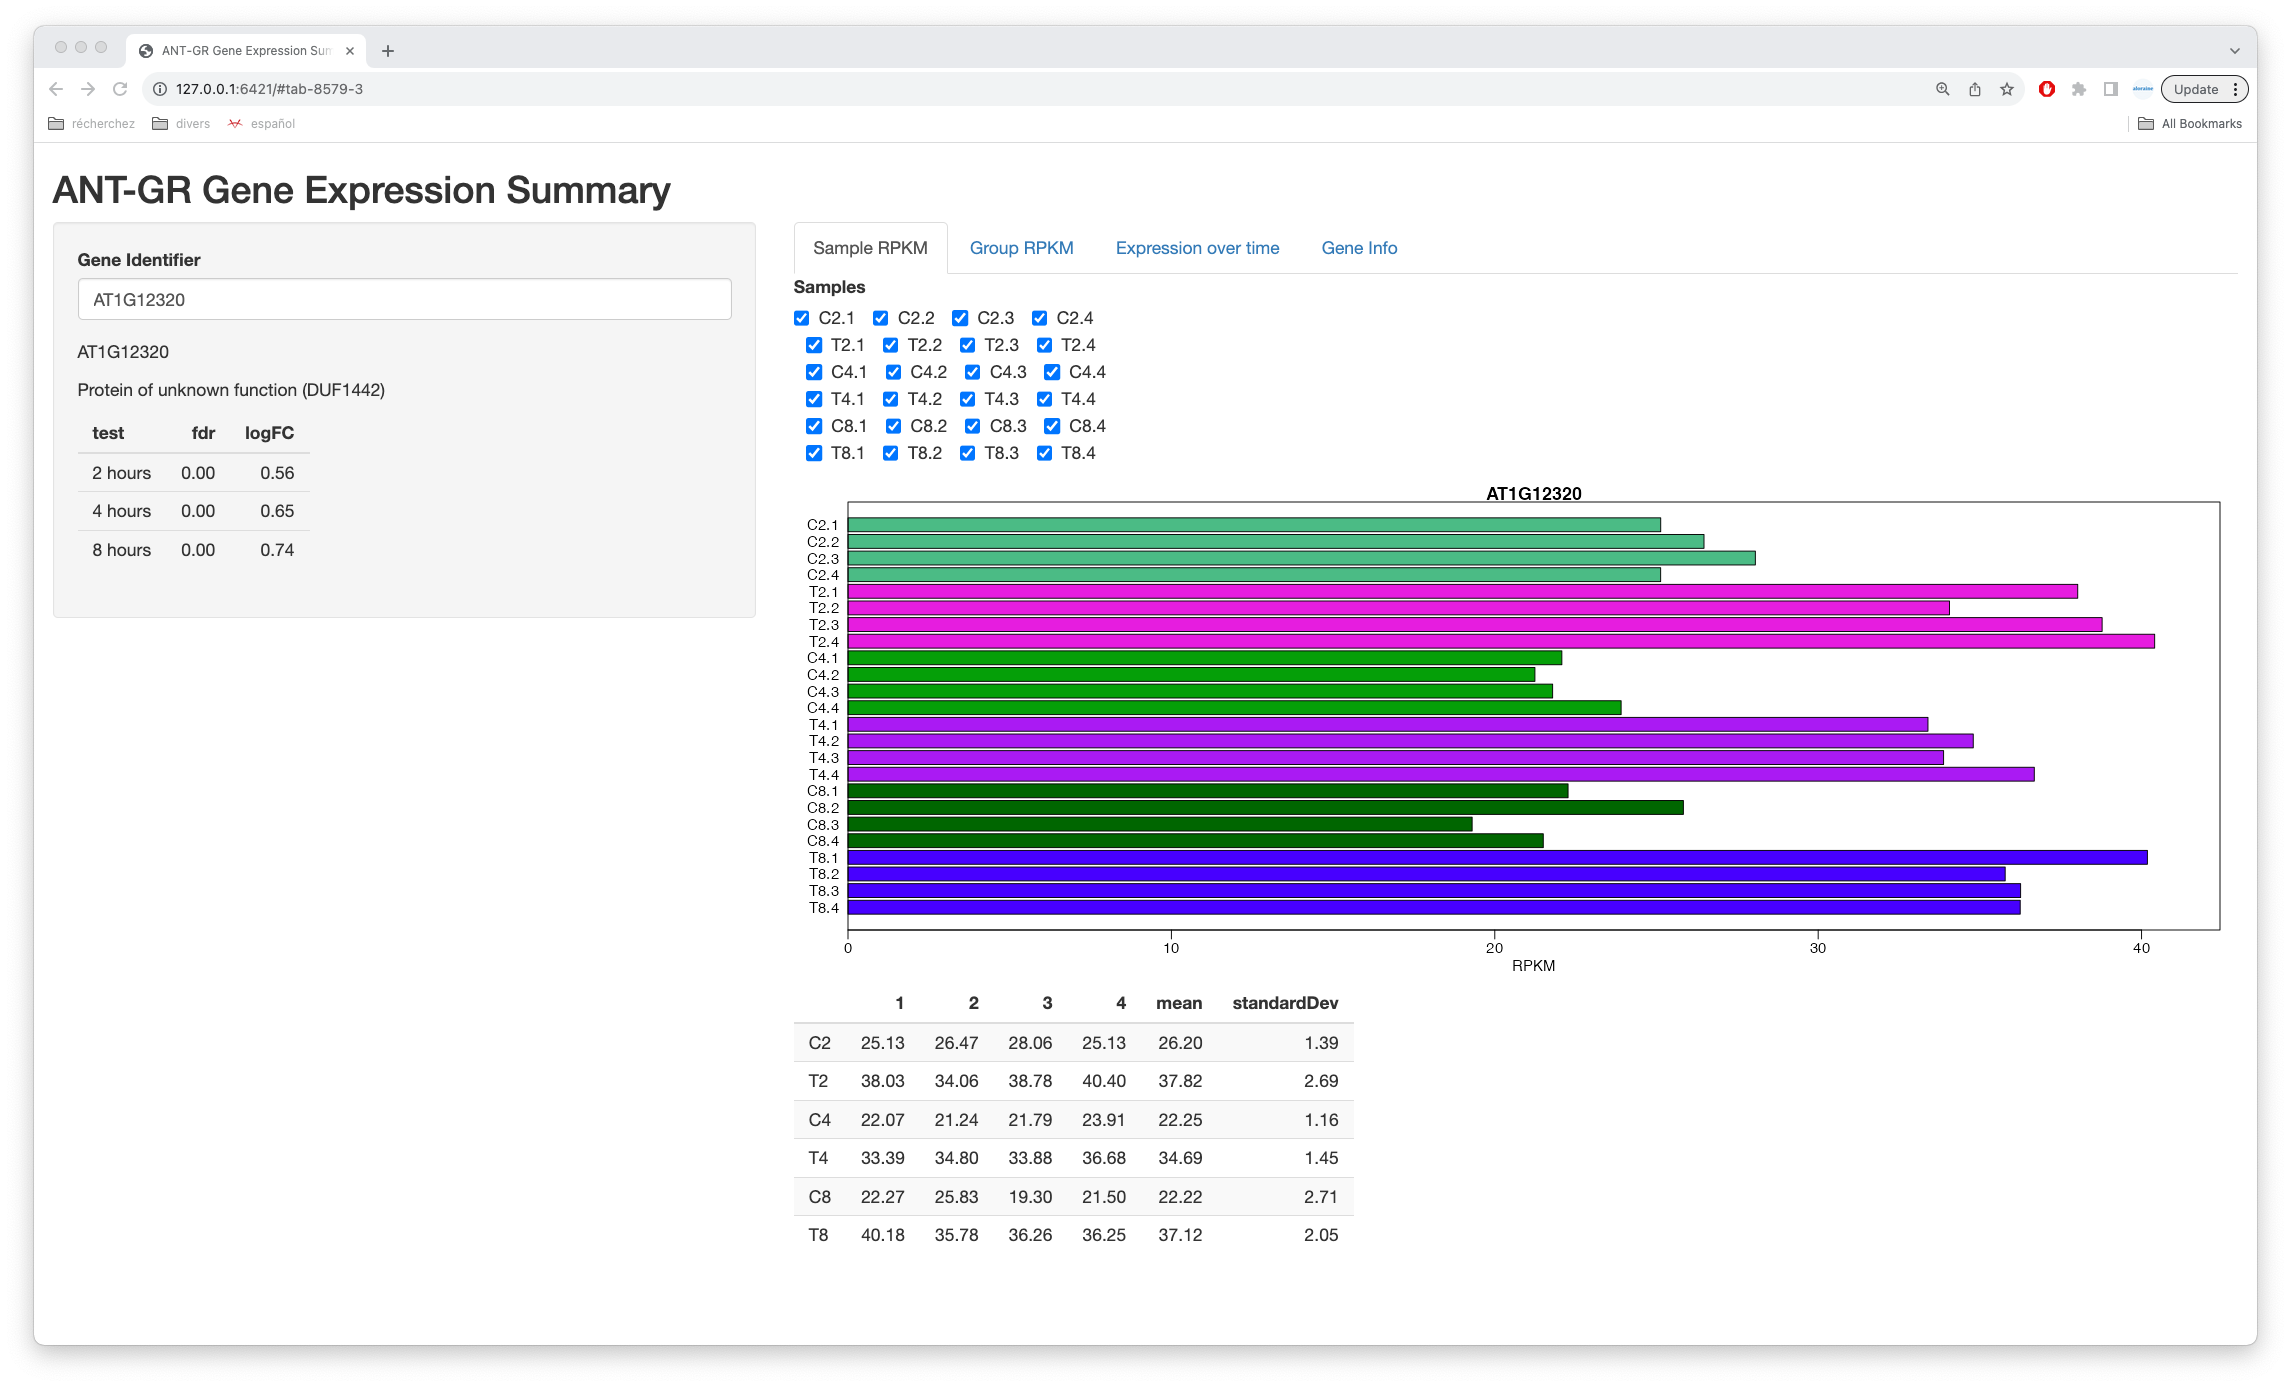
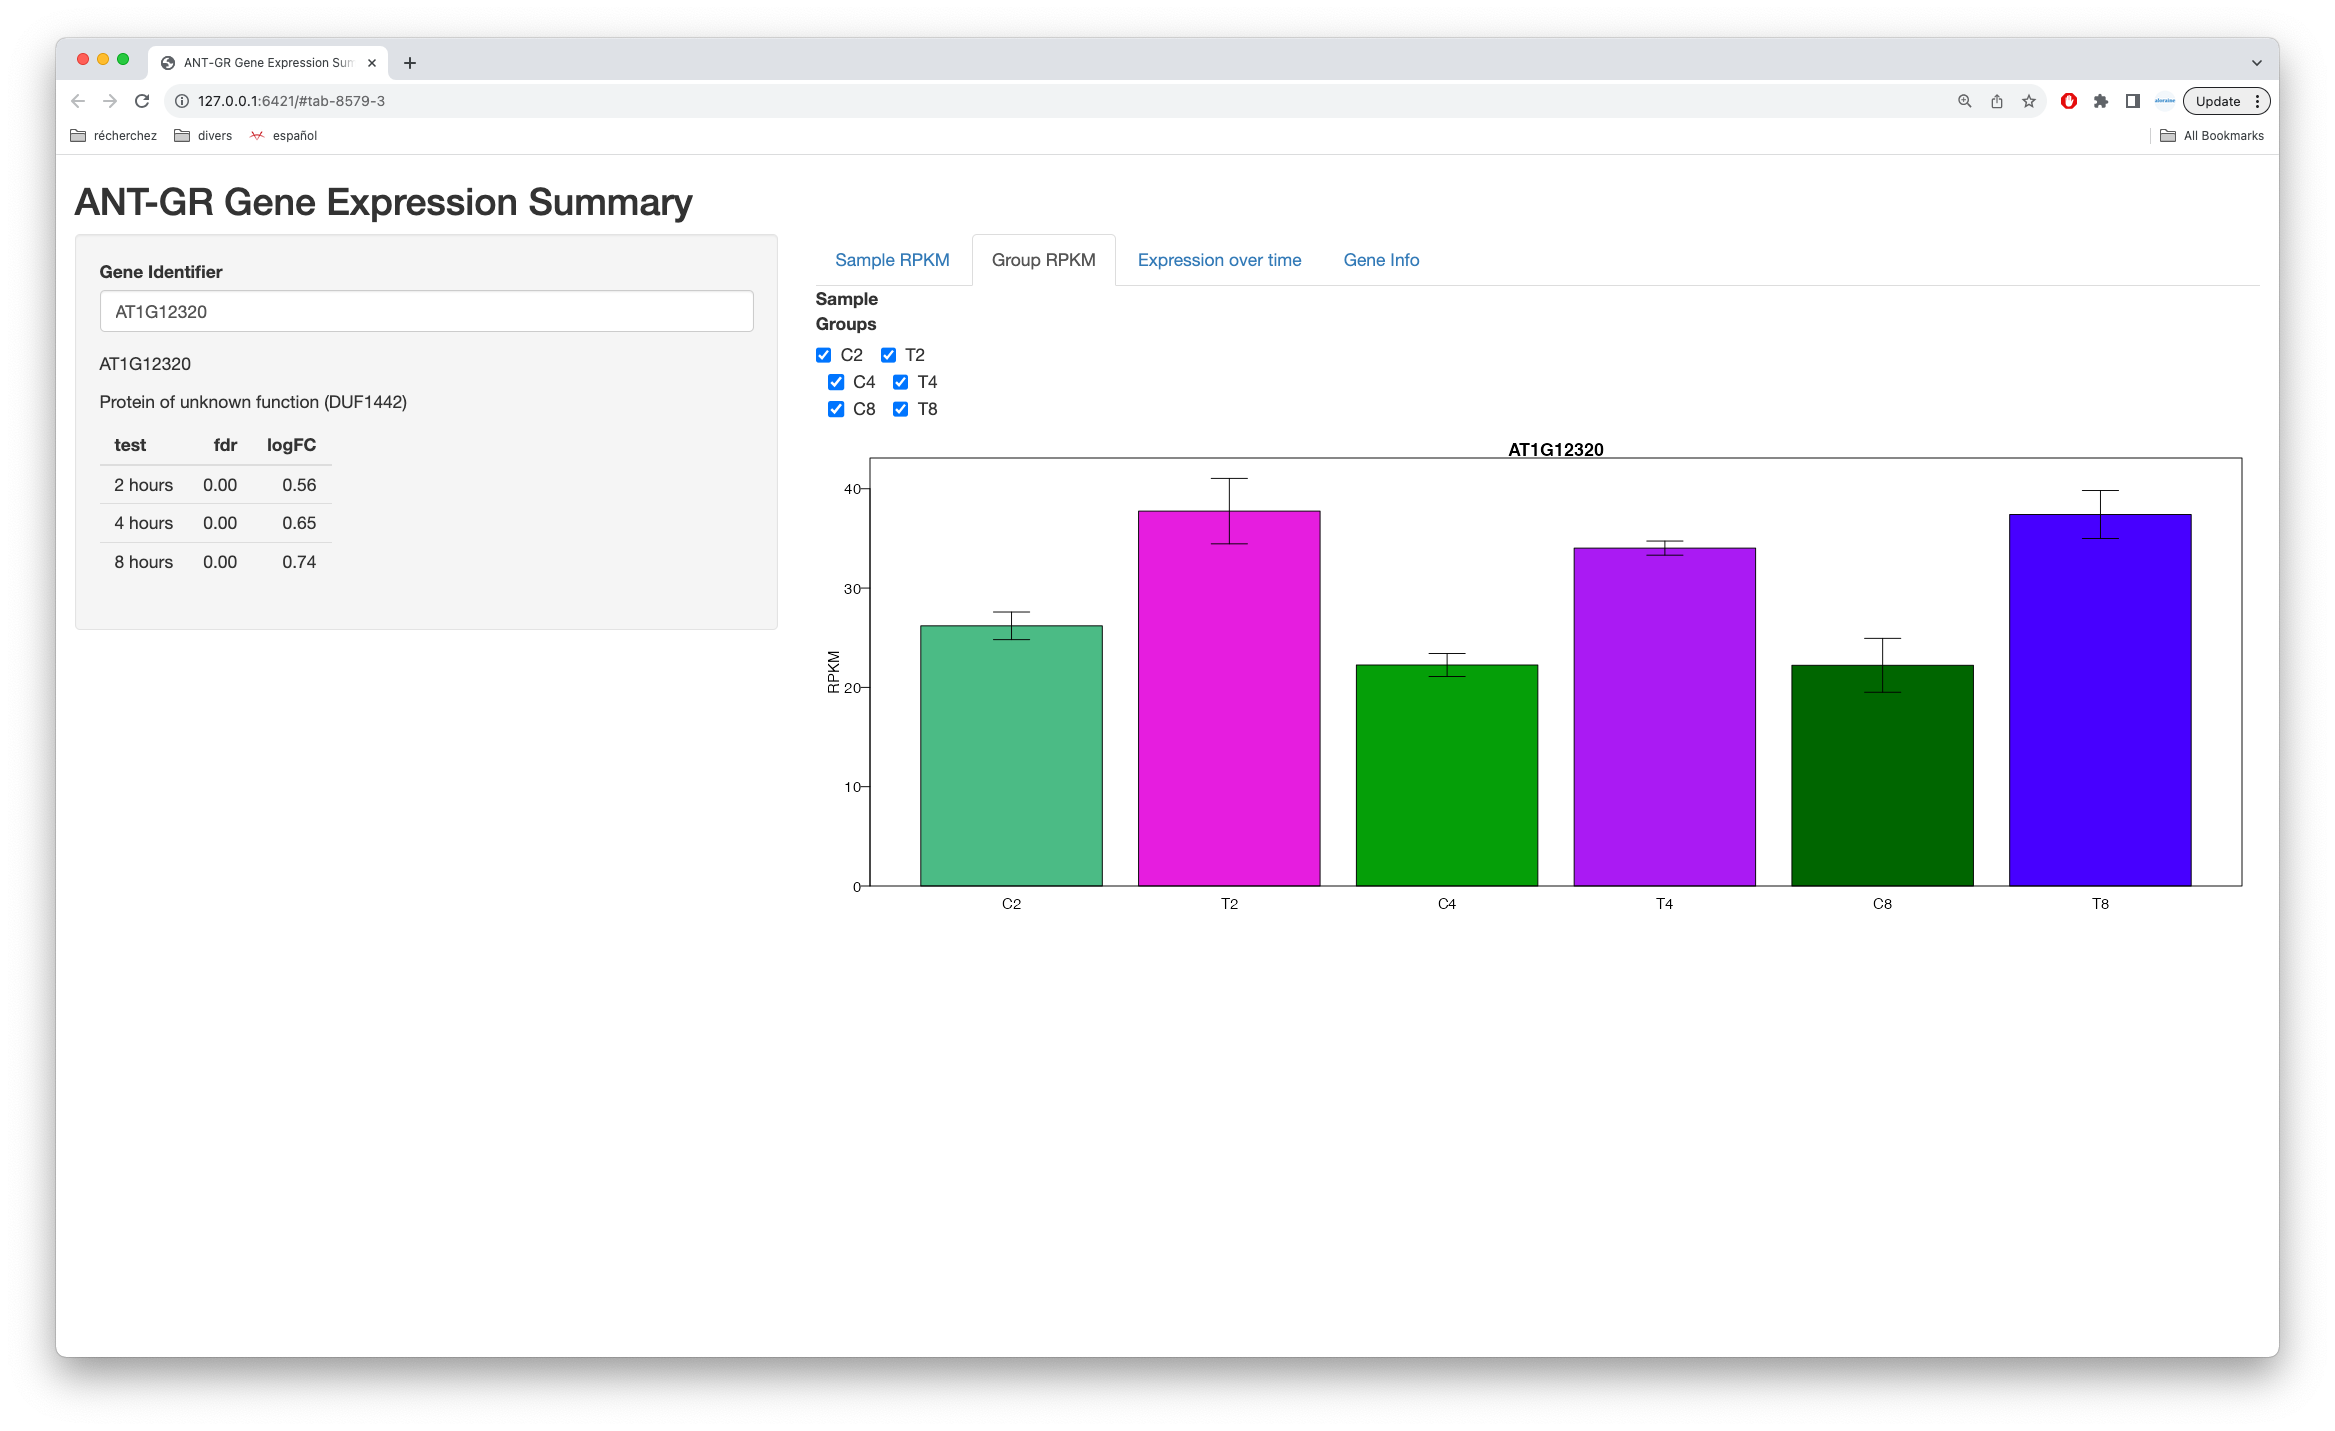
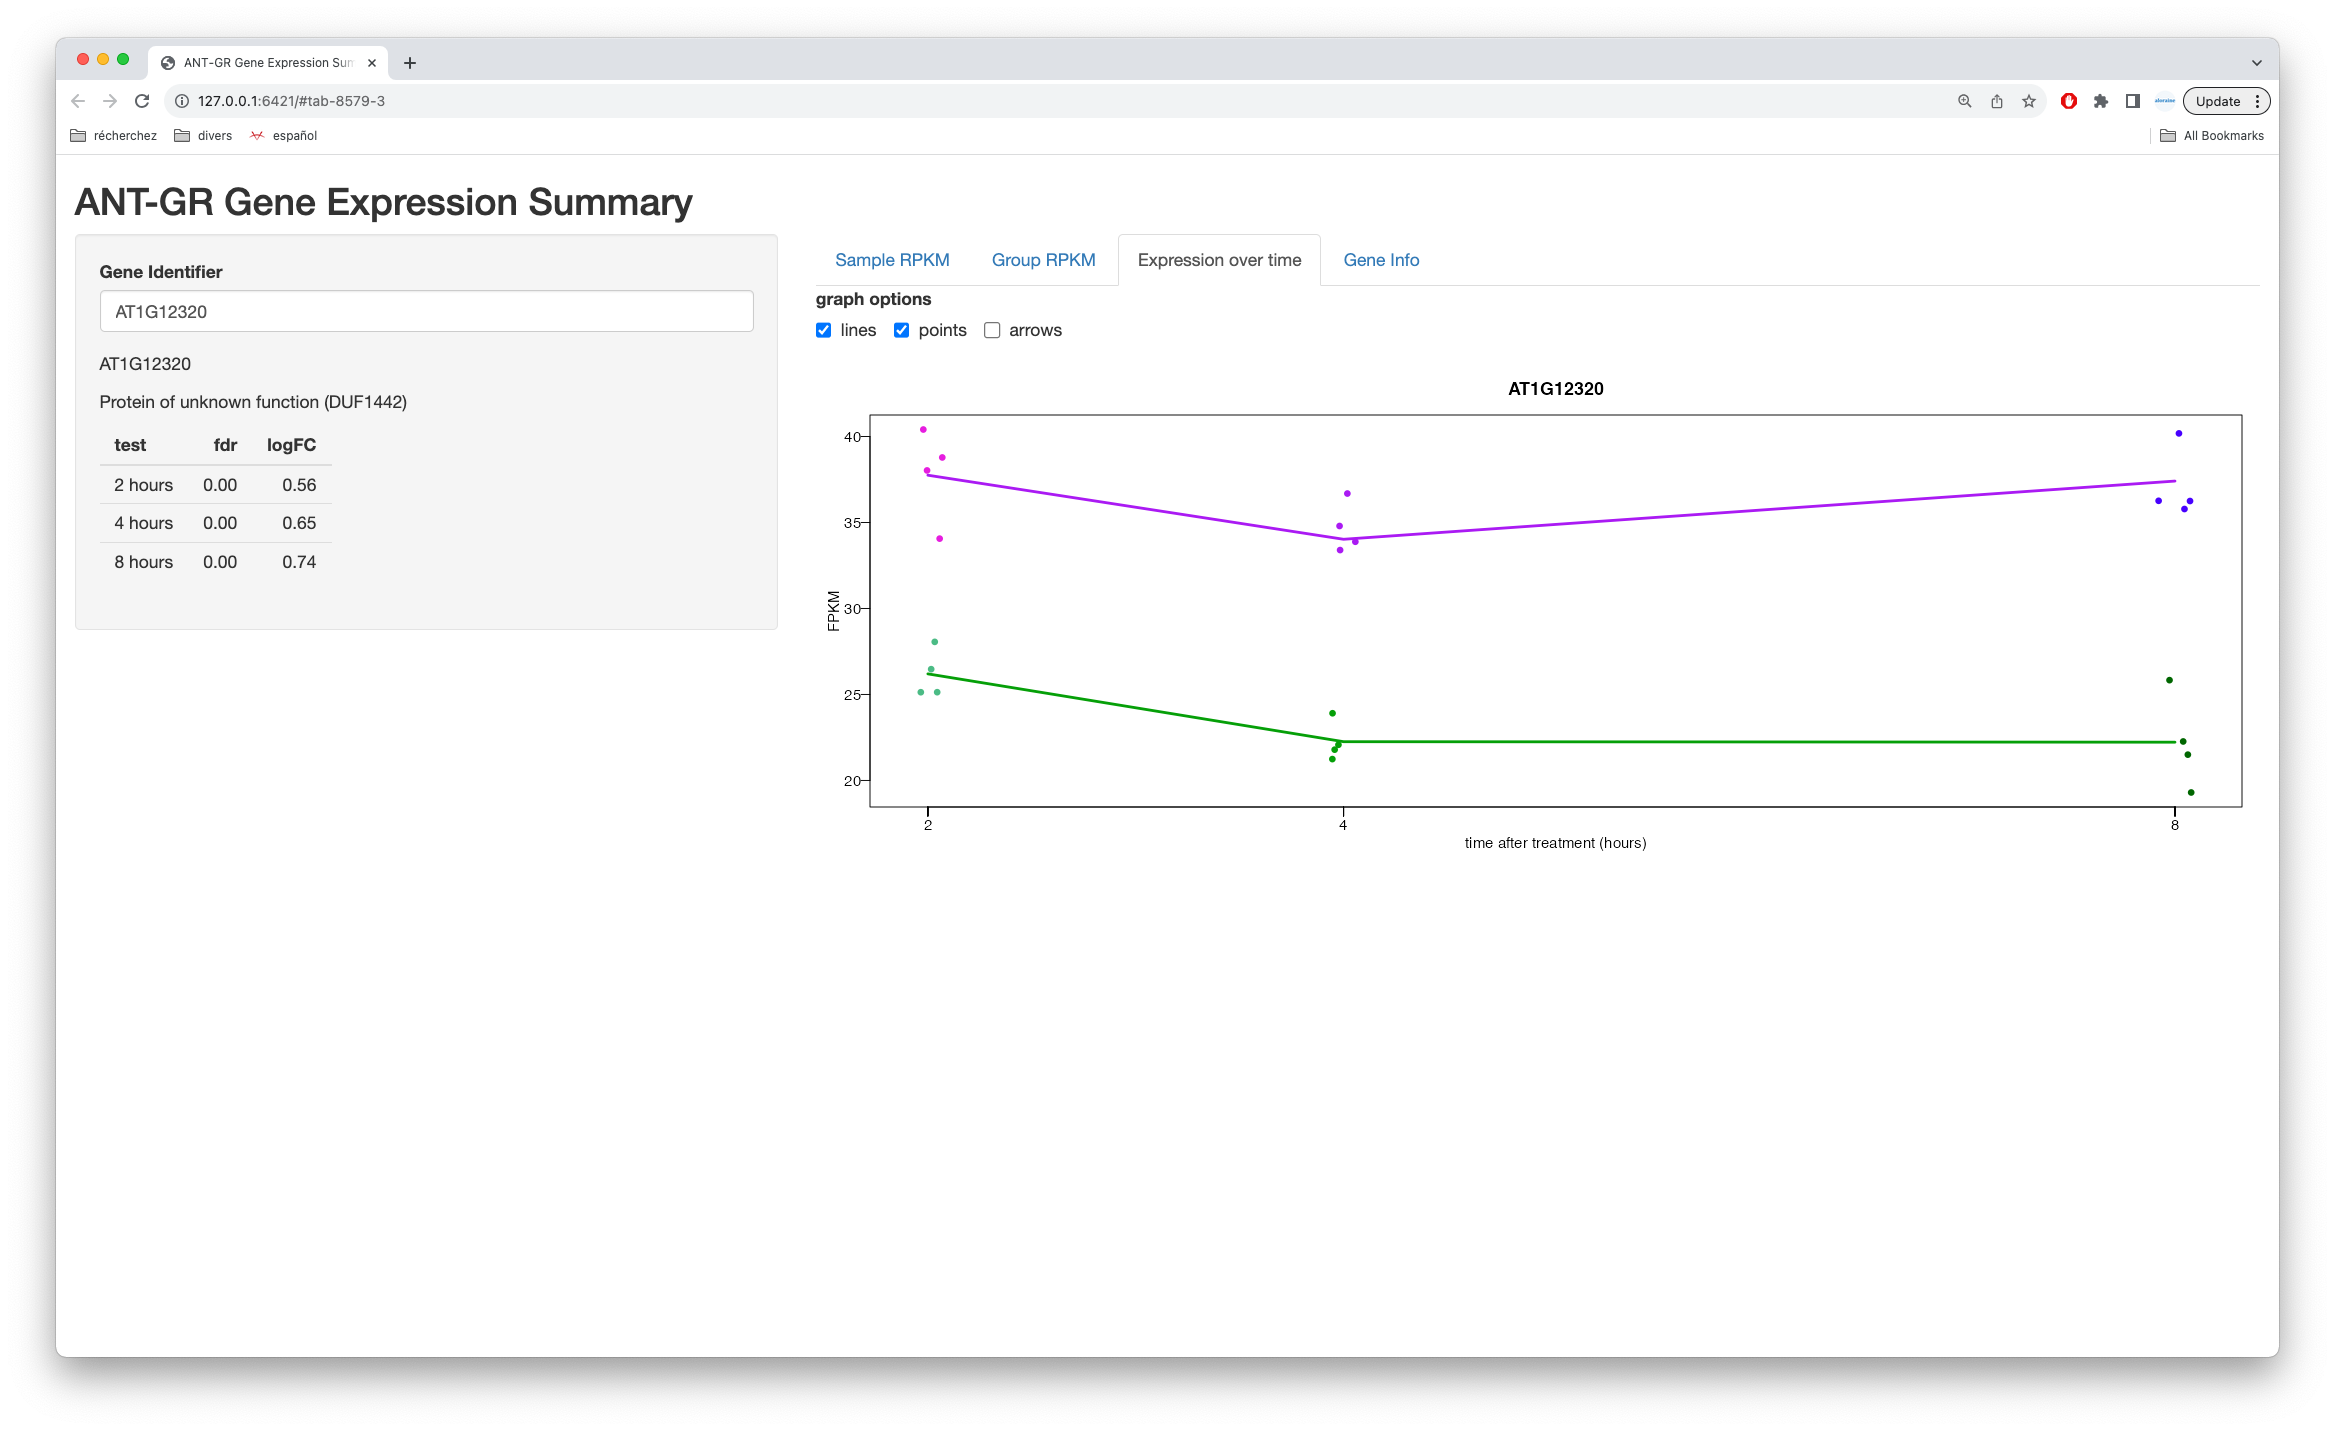
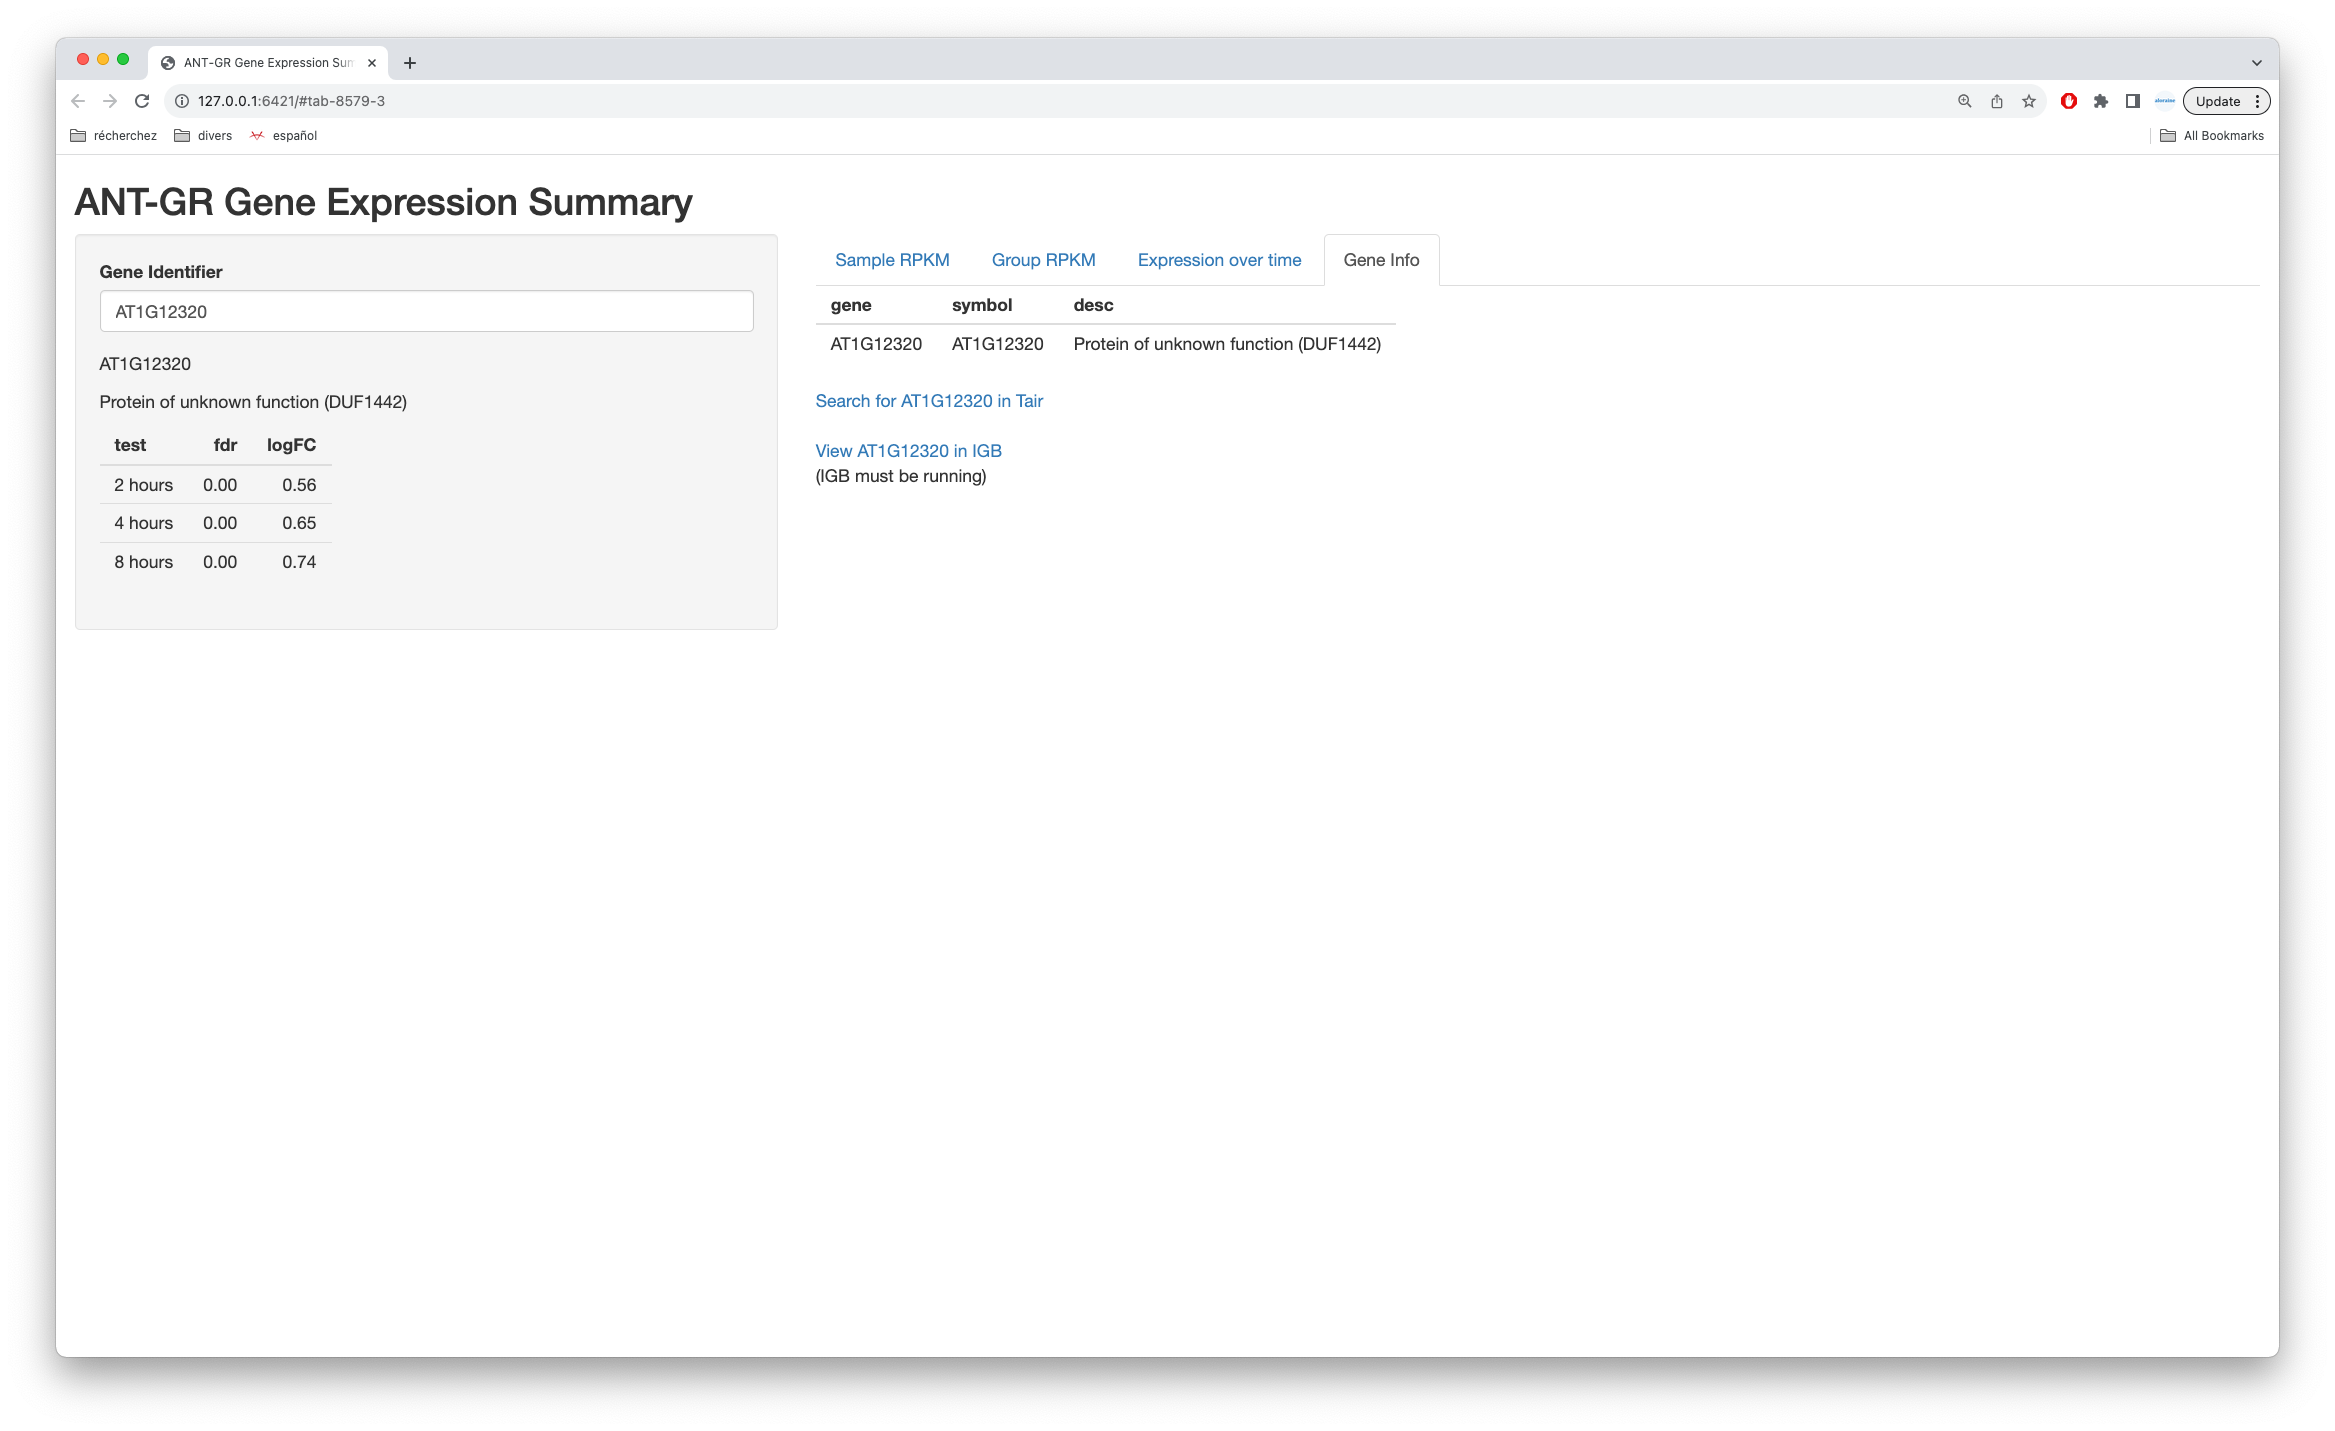
It's useful to be able to quickly look at a plot showing expression levels for a given gene in a given dataset.
We have some code that does this. It is a function named "makeBarPlot" in Common.R in time course subdirectory of flavonoid rna-seq git repository.
For this task, investigate making an R Shiny app that can maybe do the following:
- uses data files from flavonoid-rnaseq repository
- has an interface where user enters a gene name (with useful preset default value, e.g., F3H)
- shows barplot for that gene so the user can check that the expression levels make sense given the statistical results, and vice versa
Implementation suggestions:
- Save the Shiny App in the repository in a way that makes it easy to deploy
- Reference input datasets via relative paths to "results" folders
- Investigate deploying onto RStudio cloud because it may be crazy easy
Attachments
Issue Links
Activity
| Field | Original Value | New Value |
|---|---|---|
| Epic Link | IGBF-3446 [ 22548 ] |
| Assignee | Ann Loraine [ aloraine ] |
| Sprint | Fall 3 2023 Oct 2 [ 179 ] |
| Status | To-Do [ 10305 ] | In Progress [ 3 ] |
| Status | In Progress [ 3 ] | To-Do [ 10305 ] |
| Comment | [ Putting this into the next sprint for further work. ] |
| Sprint | Fall 3 2023 Oct 2 [ 179 ] | Fall 5 [ 181 ] |
| Sprint | Fall 5 [ 181 ] | Fall 4 2023 Oct 16 [ 180 ] |
| Rank | Ranked higher |
| Summary | Make Rshiny app that draws barplot for a given gene using data from a dataset | Investigate: Make Rshiny app that draws barplot for a given gene using data from a dataset |
| Status | To-Do [ 10305 ] | In Progress [ 3 ] |
| Description |
It's useful to be able to quickly look at a plot showing expression levels for a given gene in a given dataset.
We have some code that does this. It is a function named "makeBarPlot" in Common.R in time course subdirectory of flavonoid rna-seq git repository. For this task, create a shiny app that lets the user: * select a dataset from this repository (with useful preset default value) * enter a gene name (with useful preset default value, e.g., F3H) * view the barplot for that gene using the existing code Implementation suggestions: * Save the Shiny App in a subdirectory named "apps" to make it easier to find * Reference input datasets via relative paths to "results" folder * Investigate deploying onto RStudio cloud because it may be crazy easy |
It's useful to be able to quickly look at a plot showing expression levels for a given gene in a given dataset.
We have some code that does this. It is a function named "makeBarPlot" in Common.R in time course subdirectory of flavonoid rna-seq git repository. For this task, create a shiny app that lets the user: * select a dataset from this repository (with useful preset default value) * enter a gene name (with useful preset default value, e.g., F3H) * view the barplot for that gene using the existing code Implementation suggestions: * Save the Shiny App in the repository in a way that makes it easy to deploy * Reference input datasets via relative paths to "results" folders * Investigate deploying onto RStudio cloud because it may be crazy easy |
| Comment |
[ I don't think the above code should get committed to the team repository, but I would like to preserve it. Considering uploading to a git hosting service for demonstration purposes.
This should be enough: * Make new branch * Push to my fork * Add link to branch here ] |
| Comment | [ Fork and branch are: ] |
| Comment |
[ To review / test
* retrieve code for branch * open .Rproj (top-level "project" file) using RStudio desktop * click "Play" * observe user interface components appear functional ] |
| Summary | Investigate: Make Rshiny app that draws barplot for a given gene using data from a dataset | Investigate: Make Rshiny app that plots data for a given gene using data from a dataset |
| Summary | Investigate: Make Rshiny app that plots data for a given gene using data from a dataset | Investigate: Make Rshiny app that plots data for a given gene |
| Assignee | Ann Loraine [ aloraine ] |
| Description |
It's useful to be able to quickly look at a plot showing expression levels for a given gene in a given dataset.
We have some code that does this. It is a function named "makeBarPlot" in Common.R in time course subdirectory of flavonoid rna-seq git repository. For this task, create a shiny app that lets the user: * select a dataset from this repository (with useful preset default value) * enter a gene name (with useful preset default value, e.g., F3H) * view the barplot for that gene using the existing code Implementation suggestions: * Save the Shiny App in the repository in a way that makes it easy to deploy * Reference input datasets via relative paths to "results" folders * Investigate deploying onto RStudio cloud because it may be crazy easy |
It's useful to be able to quickly look at a plot showing expression levels for a given gene in a given dataset.
We have some code that does this. It is a function named "makeBarPlot" in Common.R in time course subdirectory of flavonoid rna-seq git repository. For this task, investigating creating a shiny app that can maybe do the following: * select a dataset from this repository (with useful preset default value) * enter a gene name (with useful preset default value, e.g., F3H) * view the barplot for that gene using the existing code Implementation suggestions: * Save the Shiny App in the repository in a way that makes it easy to deploy * Reference input datasets via relative paths to "results" folders * Investigate deploying onto RStudio cloud because it may be crazy easy |
| Assignee | Molly Davis [ molly ] |
| Status | In Progress [ 3 ] | Needs 1st Level Review [ 10005 ] |
| Status | Needs 1st Level Review [ 10005 ] | First Level Review in Progress [ 10301 ] |
| Status | First Level Review in Progress [ 10301 ] | To-Do [ 10305 ] |
| Status | To-Do [ 10305 ] | In Progress [ 3 ] |
| Description |
It's useful to be able to quickly look at a plot showing expression levels for a given gene in a given dataset.
We have some code that does this. It is a function named "makeBarPlot" in Common.R in time course subdirectory of flavonoid rna-seq git repository. For this task, investigating creating a shiny app that can maybe do the following: * select a dataset from this repository (with useful preset default value) * enter a gene name (with useful preset default value, e.g., F3H) * view the barplot for that gene using the existing code Implementation suggestions: * Save the Shiny App in the repository in a way that makes it easy to deploy * Reference input datasets via relative paths to "results" folders * Investigate deploying onto RStudio cloud because it may be crazy easy |
It's useful to be able to quickly look at a plot showing expression levels for a given gene in a given dataset.
We have some code that does this. It is a function named "makeBarPlot" in Common.R in time course subdirectory of flavonoid rna-seq git repository. For this task, investigate making an R Shiny app that can maybe do the following: * uses data files from flavonoid-rnaseq repository * has an interface where user enters a gene name (with useful preset default value, e.g., F3H) * shows barplot for that gene so the user can check that the expression levels make sense given the statistical results, and vice versa Implementation suggestions: * Save the Shiny App in the repository in a way that makes it easy to deploy * Reference input datasets via relative paths to "results" folders * Investigate deploying onto RStudio cloud because it may be crazy easy |
| Status | In Progress [ 3 ] | To-Do [ 10305 ] |
| Status | To-Do [ 10305 ] | In Progress [ 3 ] |
| Status | In Progress [ 3 ] | To-Do [ 10305 ] |
| Status | To-Do [ 10305 ] | In Progress [ 3 ] |
| Comment | [ *Update*: I have made my own app.R and have been adding each step of Ivory code into the app over time. For example, I have successfully used our results file and was able to adapt the code to show the gene identifier and to check it. I also posted the correct gene name below the user input with an else statement that will give corrections if wrong. Right now I am working on the data.frame in the sidebar under the gene identifier so it works with our results file. ] |
| Comment |
[ *Update since 1st demo*:
* App now includes SL4 and SL5 genes * Includes all experiments in the data frame for user to see * Removed scientific notation * Added note about NA * Having some issues with getting all the data to show up for each experiment with the chosen gene * Currently working on main plots ] |
| Assignee | Molly Davis [ molly ] |
| Status | In Progress [ 3 ] | Needs 1st Level Review [ 10005 ] |
| Status | Needs 1st Level Review [ 10005 ] | First Level Review in Progress [ 10301 ] |
| Status | First Level Review in Progress [ 10301 ] | Ready for Pull Request [ 10304 ] |
| Status | Ready for Pull Request [ 10304 ] | Pull Request Submitted [ 10101 ] |
| Status | Pull Request Submitted [ 10101 ] | Reviewing Pull Request [ 10303 ] |
| Status | Reviewing Pull Request [ 10303 ] | Merged Needs Testing [ 10002 ] |
| Status | Merged Needs Testing [ 10002 ] | Post-merge Testing In Progress [ 10003 ] |
| Resolution | Done [ 10000 ] | |
| Status | Post-merge Testing In Progress [ 10003 ] | Closed [ 6 ] |