Details
-
Type:
Task
-
Status: Closed (View Workflow)
-
Priority:
 Major
Major
-
Resolution: Done
-
Affects Version/s: None
-
Fix Version/s: None
-
Labels:None
-
Story Points:2
-
Sprint:Fall 8, Spring 1, Spring 2
Description
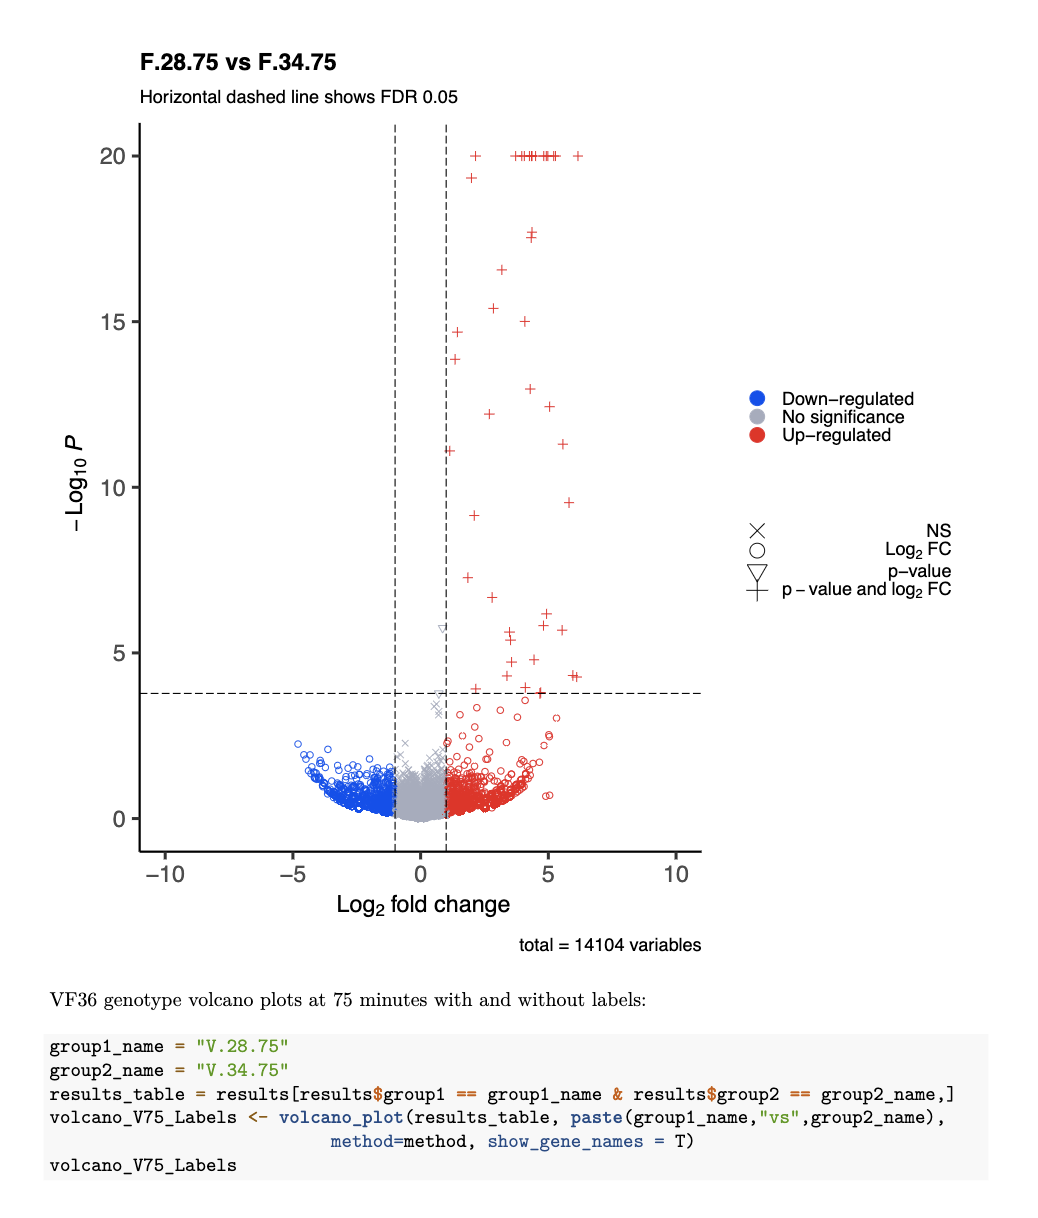
Change the negative log value y-axis to have a max of 20 after being transformed and make the higher numbers also 20 so that they are at the ceiling of the plot. James Pease recommends this so the plot looks more like a volcano.
Files:
- FindControlVsStressDEGenes-SL4-DESeq2.Rmd
- StatFunctions.R
Note: These changes need to be implemented with all of the other FindControlVsStress & MakeCustomVolcanoPlots markdowns.
Attachments
Issue Links
Activity
This is a great idea.
I will explore the interactive Rshiny soonish!
Rob
Ann to tag the repository to indicate which version is associated with the submitted article. Rob will proceed with Molly to add the new "ceiling" changes to the "make volcano plots" Markdowns.
TODO as part of this ticket. To implement a small change to the volcano plot so that when plotting, the y-axis for p-value has a ceiling of 1e-20.
Values above this number will still be plotted as 1e-20 and not just dissappear. If we simply set the y-axis max to 1e-20, we'd lose key information!!
The one line code snippet that will change the ceiling of the Y-axis in the volcano plot method in "StatFunctions.R".
d=results_table
d$pvalue= ifelse(-log10(d$pvalue) < 20,d$pvalue,1e-20)
Using the if-else function, this will check if the -log10 of the pvalue is less than 20. If it is, it remains the same. If it is GREATER than 20, the p-value gets converted to 1e-20 in the table.
Upon Molly's return, her and I will meet and implement this change into her code, test it and repo it !!
Ann added new tag: TPC2023-PIRA-01149R1
This is the manuscript identifier the journal (Plant Cell) assigned.
The commit first made after the article was submitted adds the "manuscript received" email from the journal addressed to me. I think this is an automated email that gets sent out when an article gets accepted for review. So this seemed like a good way to mark the state of the repository as it existed then.
Moving out of current sprint to await RR & MD next availability.
Branch: https://bitbucket.org/mdavis4290/molly5-flavonoid-rnaseq/branch/IGBF-3530
Files to review:
- MakeCustomVolcanoPlots.Rmd
- MakeCustomVolcanoPlots.pdf
- CustomVolcanoPlots-SL4-DeSeq2.pdf
Review:
- Please check the changes to MakeCustomVolcanoPlots.Rmd and make sure it is just changing the y-axis
- Review the knitted MakeCustomVolcanoPlots.pdf and make sure each volcano plot has the 20 max ceiling and points higher than 20 are at the ceiling
- Review CustomVolcanoPlots-SL4-DeSeq2.pdf to ensure that the volcano plots are ready to show to muday lab and in the future publish
Reviewer: Robert Reid
Tested out the rmd file in my own environment and it looks to be working correctly.
The y-axes are all correct at "20", aka 1e-20.

Screen shot of what I got. Matches the PDF file.
I think this is ready to go!
PR is merged. Ready for testing.
Testing:
Files to test in flavonoid repo:
MakeCustomVolcanoPlots.Rmd
MakeCustomVolcanoPlots.pdf
CustomVolcanoPlots-SL4-DeSeq2.pdf
- Run and knit MakeCustomVolcanoPlots.Rmd markdown to ensure it works properly
- Please check the changes to MakeCustomVolcanoPlots.Rmd and make sure it is just changing the y-axis
- Review the knitted MakeCustomVolcanoPlots.pdf and make sure each volcano plot has the 20 max ceiling and points higher than 20 are at the ceiling
- Review CustomVolcanoPlots-SL4-DeSeq2.pdf to ensure that the volcano plots are ready to show to muday lab and in the future publish
Notes: Ran into no issues running the markdown and the knitted pdf looks fine. Only the y-axis is changed and the ceiling max is set to 20. The plots pdf looks good and more improvements for point spacing and coloration have been made into individual tickets. IGBF-3562 & IGBF-3558
Next step: Inform Muday lab of changes and next steps
Moving ticket to done!
An idea:
Since our lab scientists rely a lot on volcano style plots to understand their data, we ought to invest in making these plots easier for them to create and modify, using output from differential expression analyses. We could make the scientists an R Shiny app for this, then deploy it on our own infrastructure or using a trustworthy hosting service like https://shiny.posit.co/r/deploy.html.
I found a github repo with what looks like a good starting point for an interactive volcano plot R Shiny app - https://github.com/FredHutch/interactiveVolcano
Please note: I have not tried to run this app. It might not be possible due to bit rot, as the last commit was three years ago.
Regarding the "squash the upper points" variation on a volcano plot: