Details
-
Type:
Task
-
Status: Closed (View Workflow)
-
Priority:
 Major
Major
-
Resolution: Done
-
Affects Version/s: None
-
Fix Version/s: None
-
Labels:None
-
Story Points:2
-
Sprint:Fall 8, Spring 1, Spring 2
Description
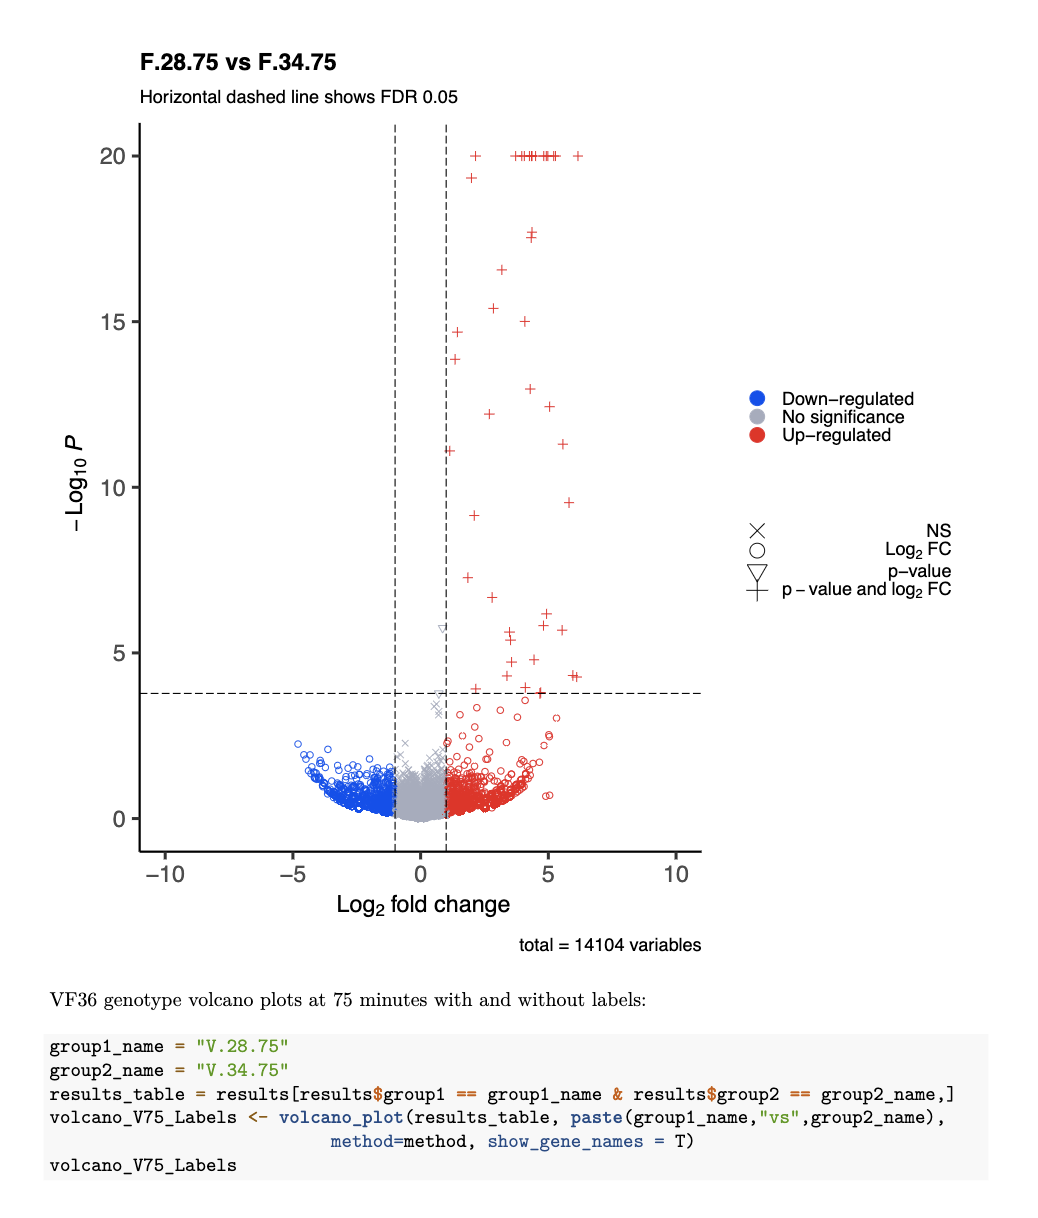
Change the negative log value y-axis to have a max of 20 after being transformed and make the higher numbers also 20 so that they are at the ceiling of the plot. James Pease recommends this so the plot looks more like a volcano.
Files:
- FindControlVsStressDEGenes-SL4-DESeq2.Rmd
- StatFunctions.R
Note: These changes need to be implemented with all of the other FindControlVsStress & MakeCustomVolcanoPlots markdowns.