Details
-
Type:
Task
-
Status: Closed (View Workflow)
-
Priority:
 Trivial
-
Resolution: Done
-
Affects Version/s: None
-
Fix Version/s: None
-
Labels:None
-
Story Points:2
-
Epic Link:
-
Sprint:Spring 6, Spring 7
Description
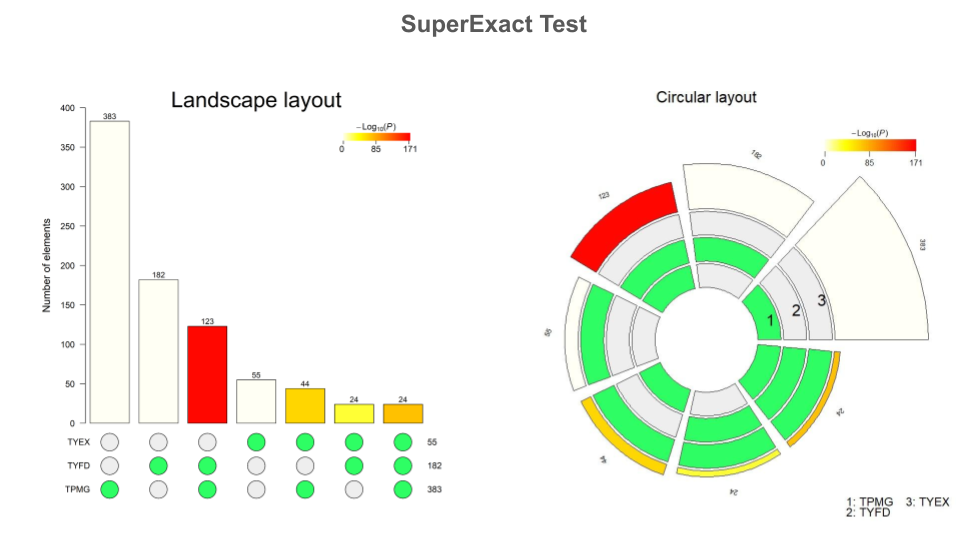
In Kelsey's March presentation, she showed a new way to display Venn Diagrams, that a re similar to UpSetR plots but are circular.
I inquired how these were made and she shared the tool as seen in the email below.
It would be worth trying this out and possibly adding it to our toolset repertoire.
GOAL: To test this tool out on some tomato data.
Hi Rob,
Absolutely! I am happy to share. I used the SuperExactTest package in R to calculate the p-values of the overlapping DEGs among cultivars. This tutorial was very helpful to use and essentially "plug in" my data. The "total" number of genes I used was 34,075, based on the number of genes in SL4.0.
Feel free to let me know if you would like to see my code or if you have any thoughts or questions!
Best,
Kelsey