Details
-
Type:
Task
-
Status: Needs 1st Level Review (View Workflow)
-
Priority:
 Major
Major
-
Resolution: Unresolved
-
Affects Version/s: None
-
Fix Version/s: None
-
Labels:None
-
Story Points:2
-
Epic Link:
-
Sprint:Spring 3, Summer 2026
Description
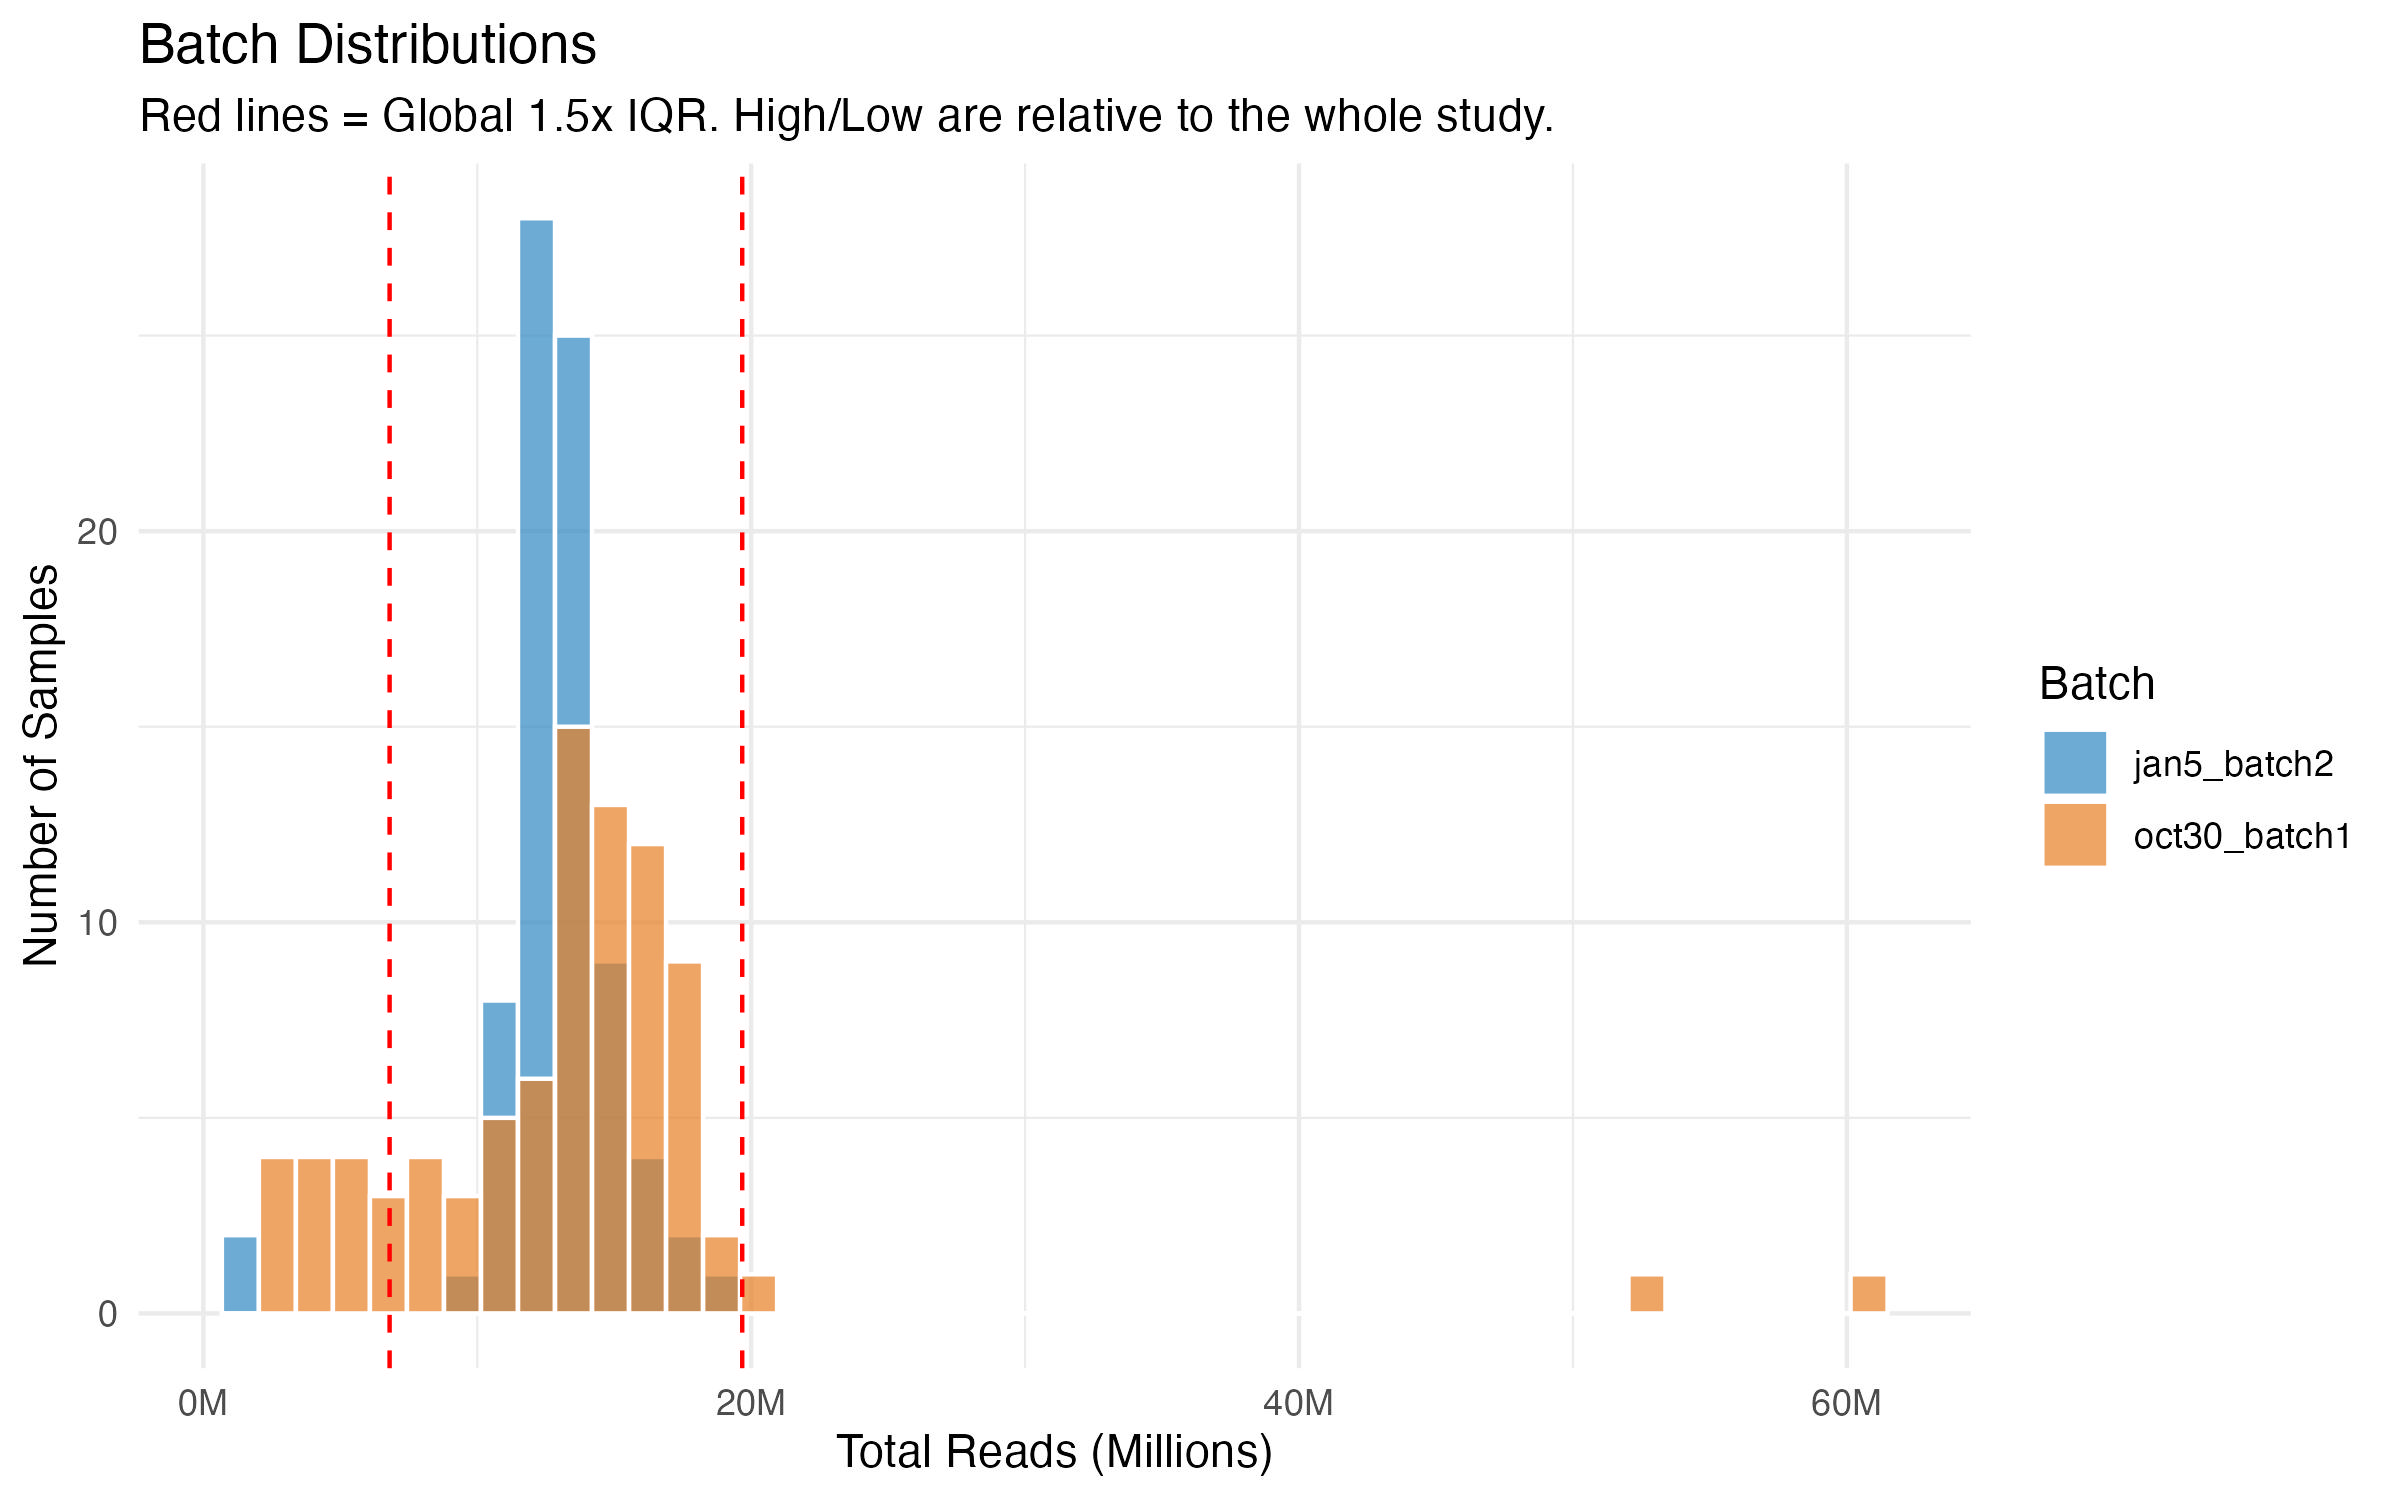
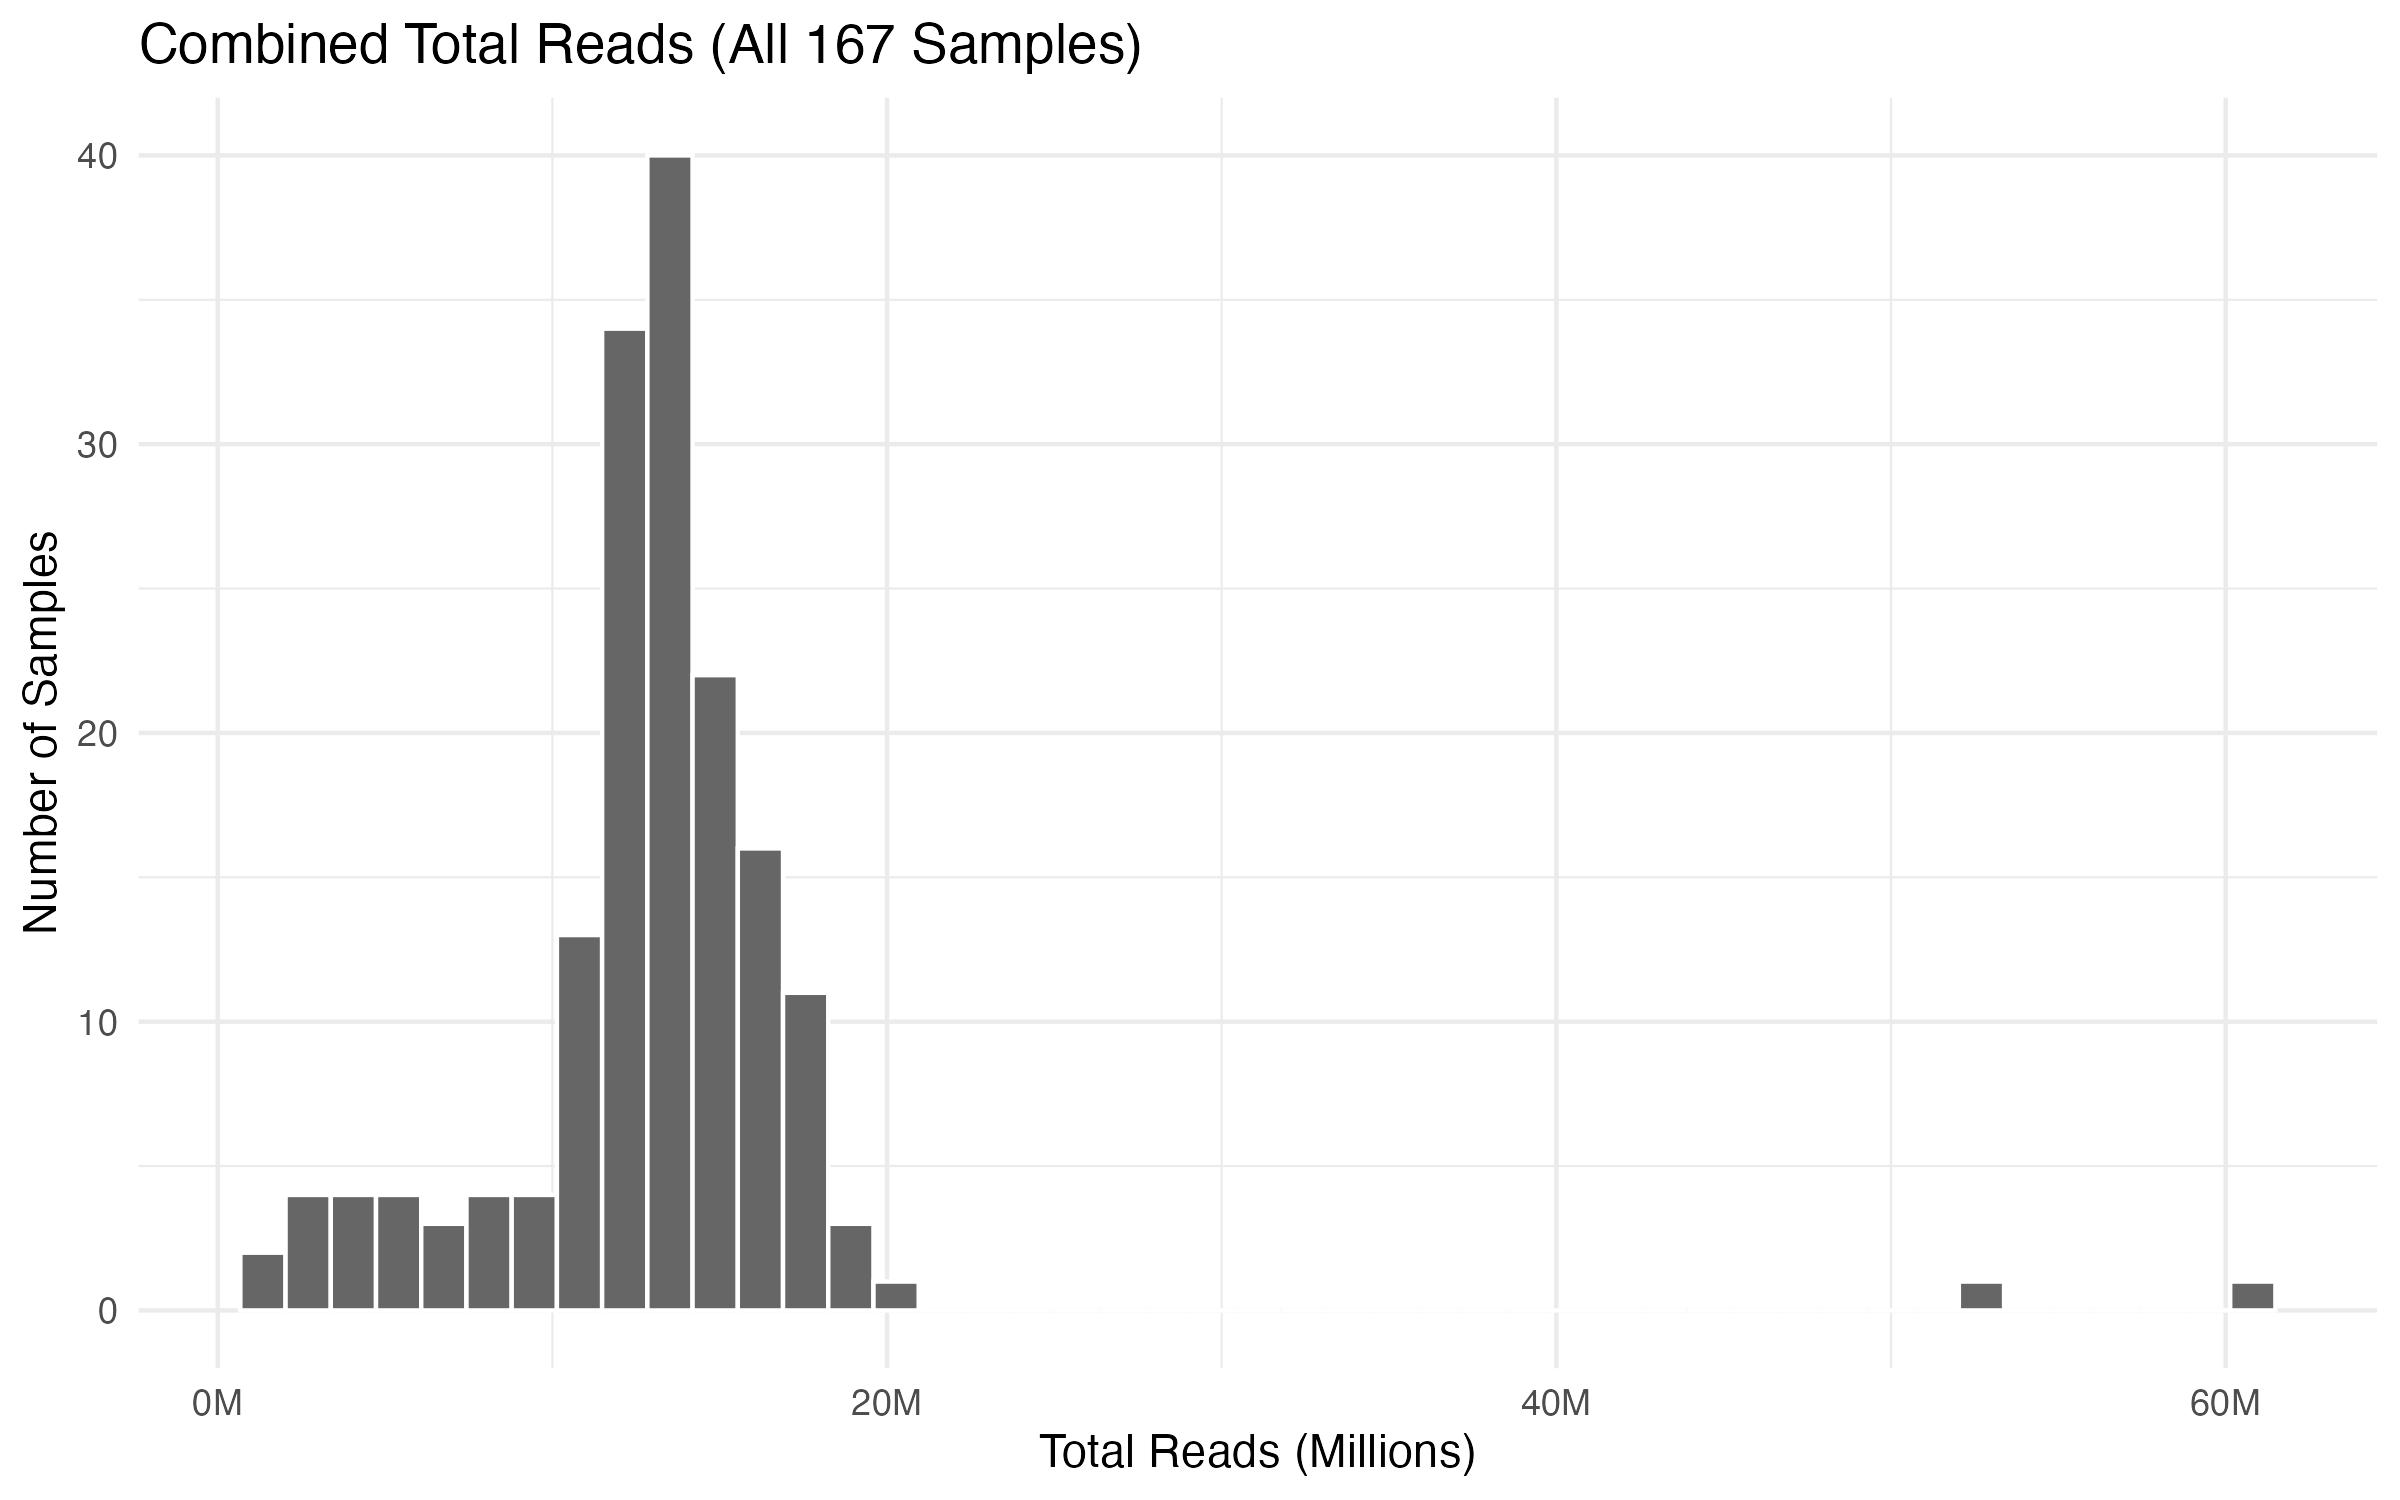
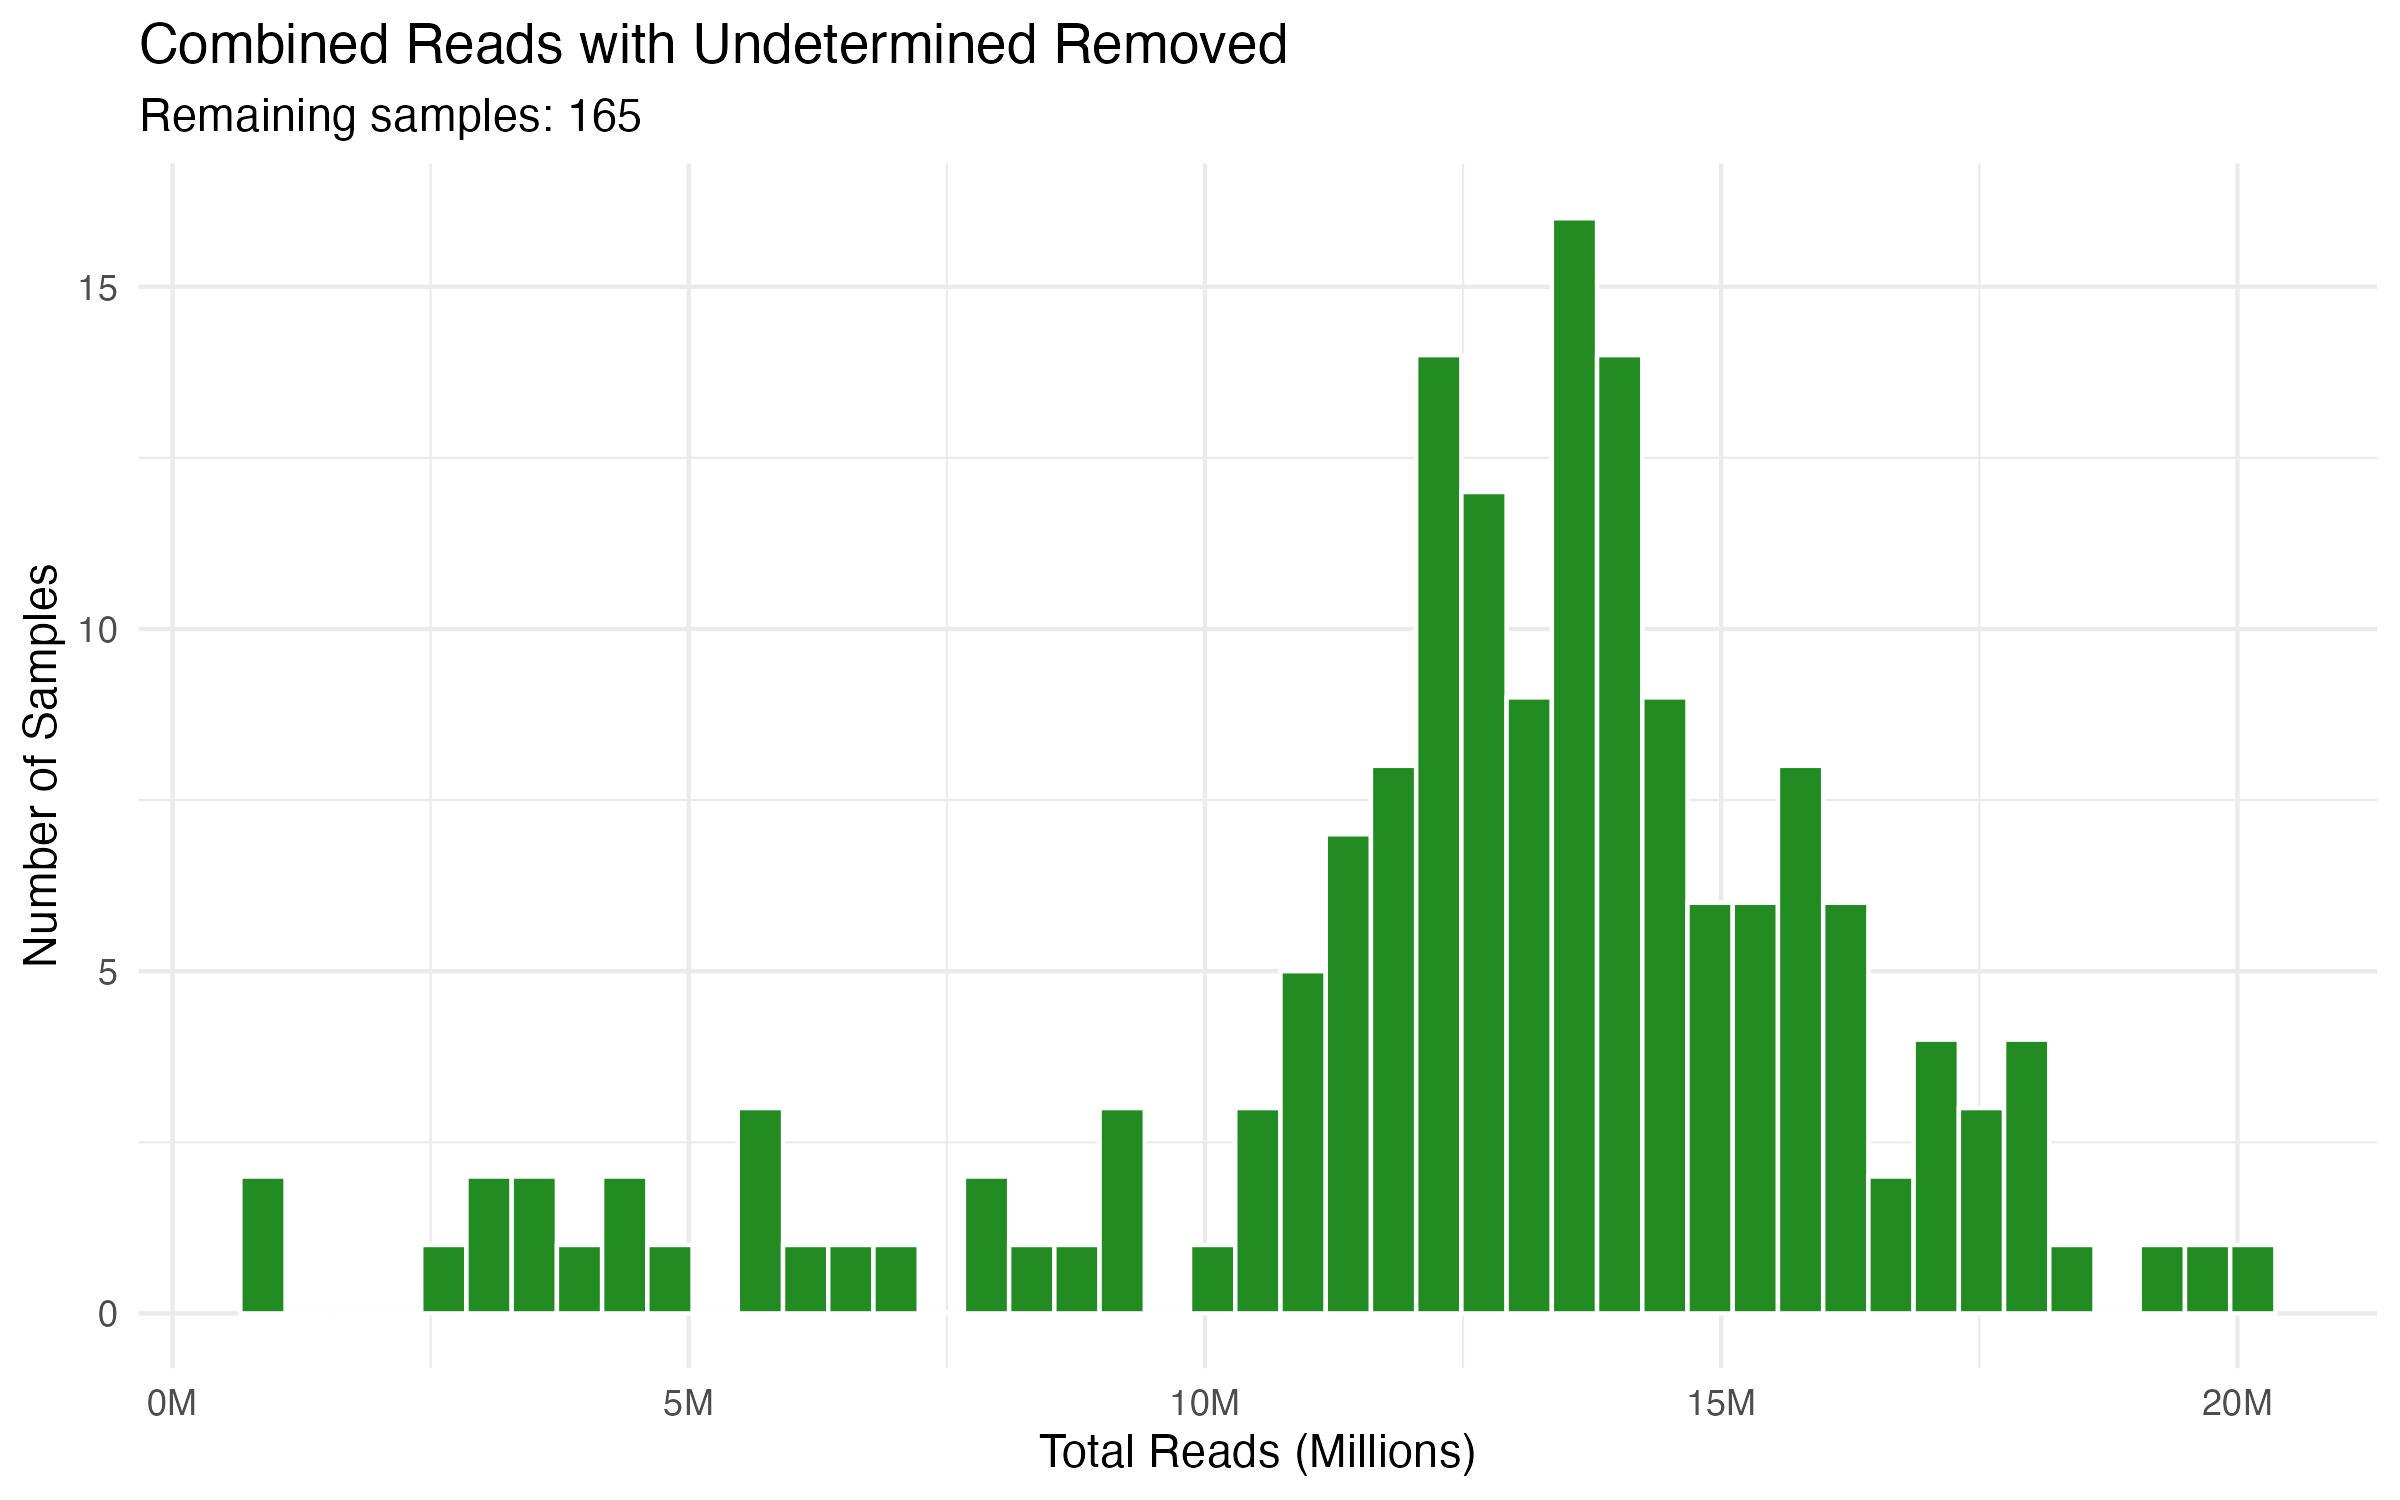
GOAL: We have 160+ columns of data.
It would be nice to see a distribution of how many reads we have per sample.
Let's pull the salmon counts table in R.
And then look up ways we can summarize this, i.e., distribution curve, etc.....
Tables were inserted here: https://docs.google.com/presentation/d/17Jk_Di338UJxkExURRhx23d-Do1meAHGK8Ua7Fw62fg/edit?usp=sharing.