Details
-
Type:
Task
-
Status: Needs 1st Level Review (View Workflow)
-
Priority:
 Major
Major
-
Resolution: Unresolved
-
Affects Version/s: None
-
Fix Version/s: None
-
Labels:None
-
Story Points:2
-
Epic Link:
-
Sprint:Spring 3, Summer 2026
Description
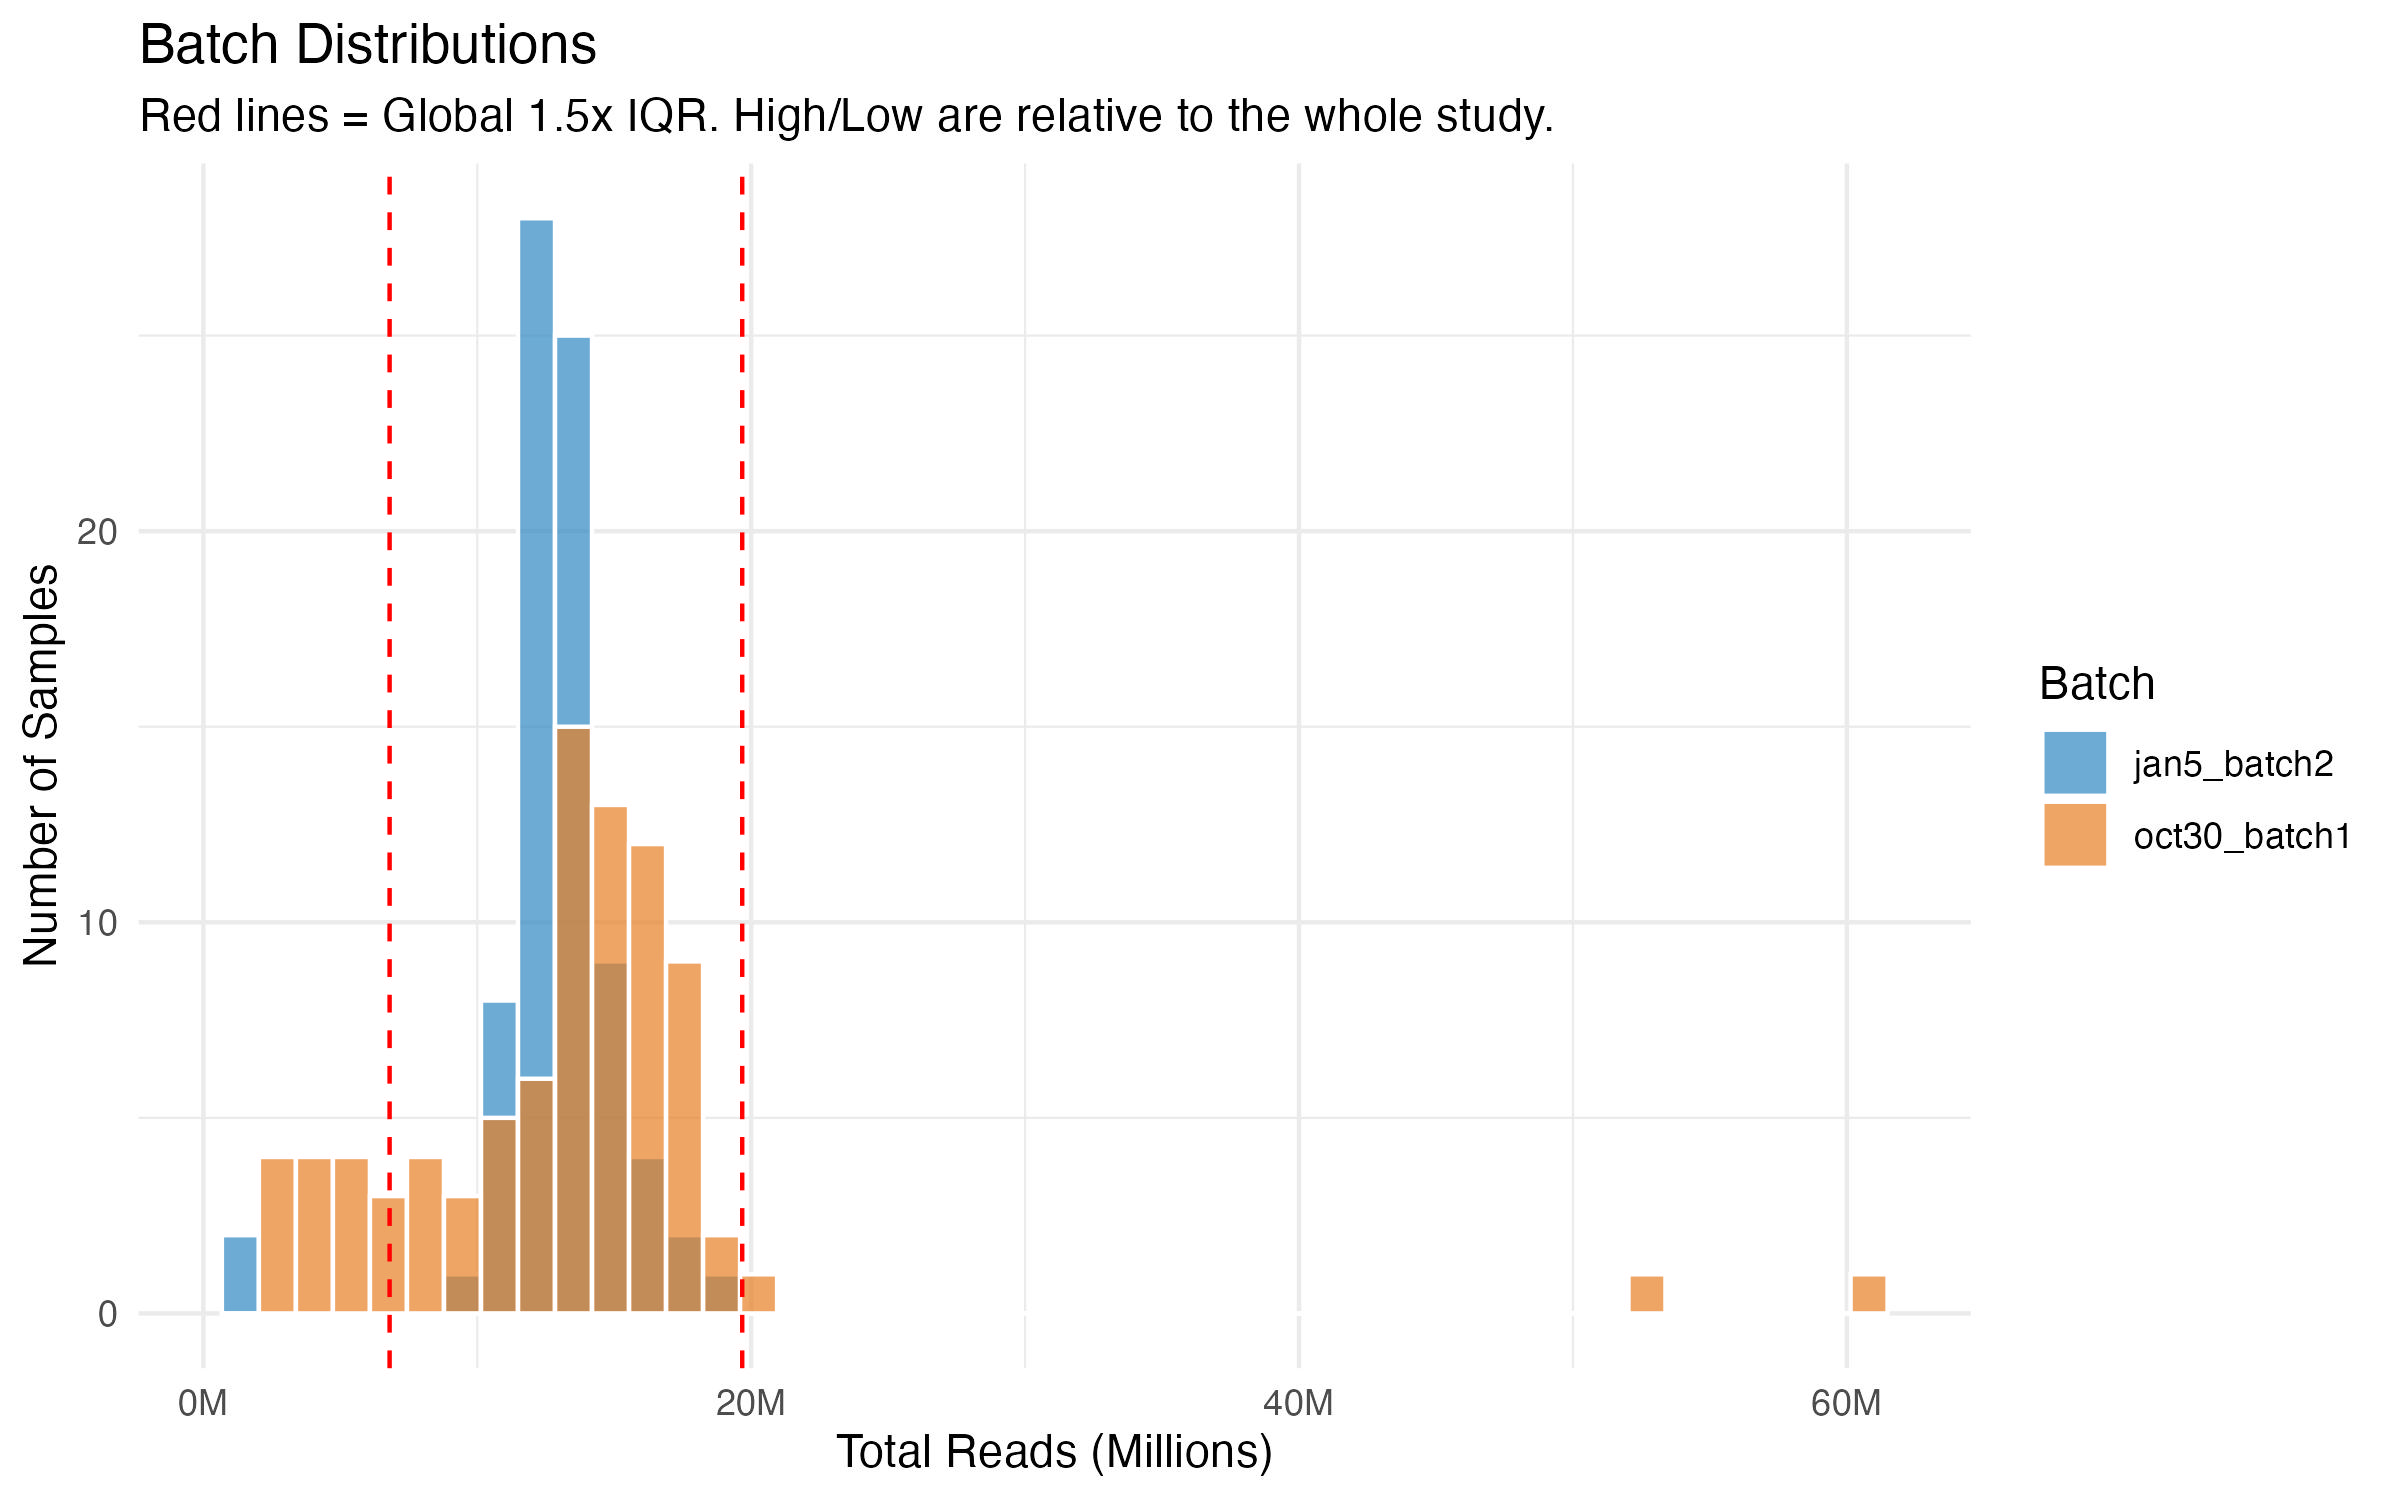
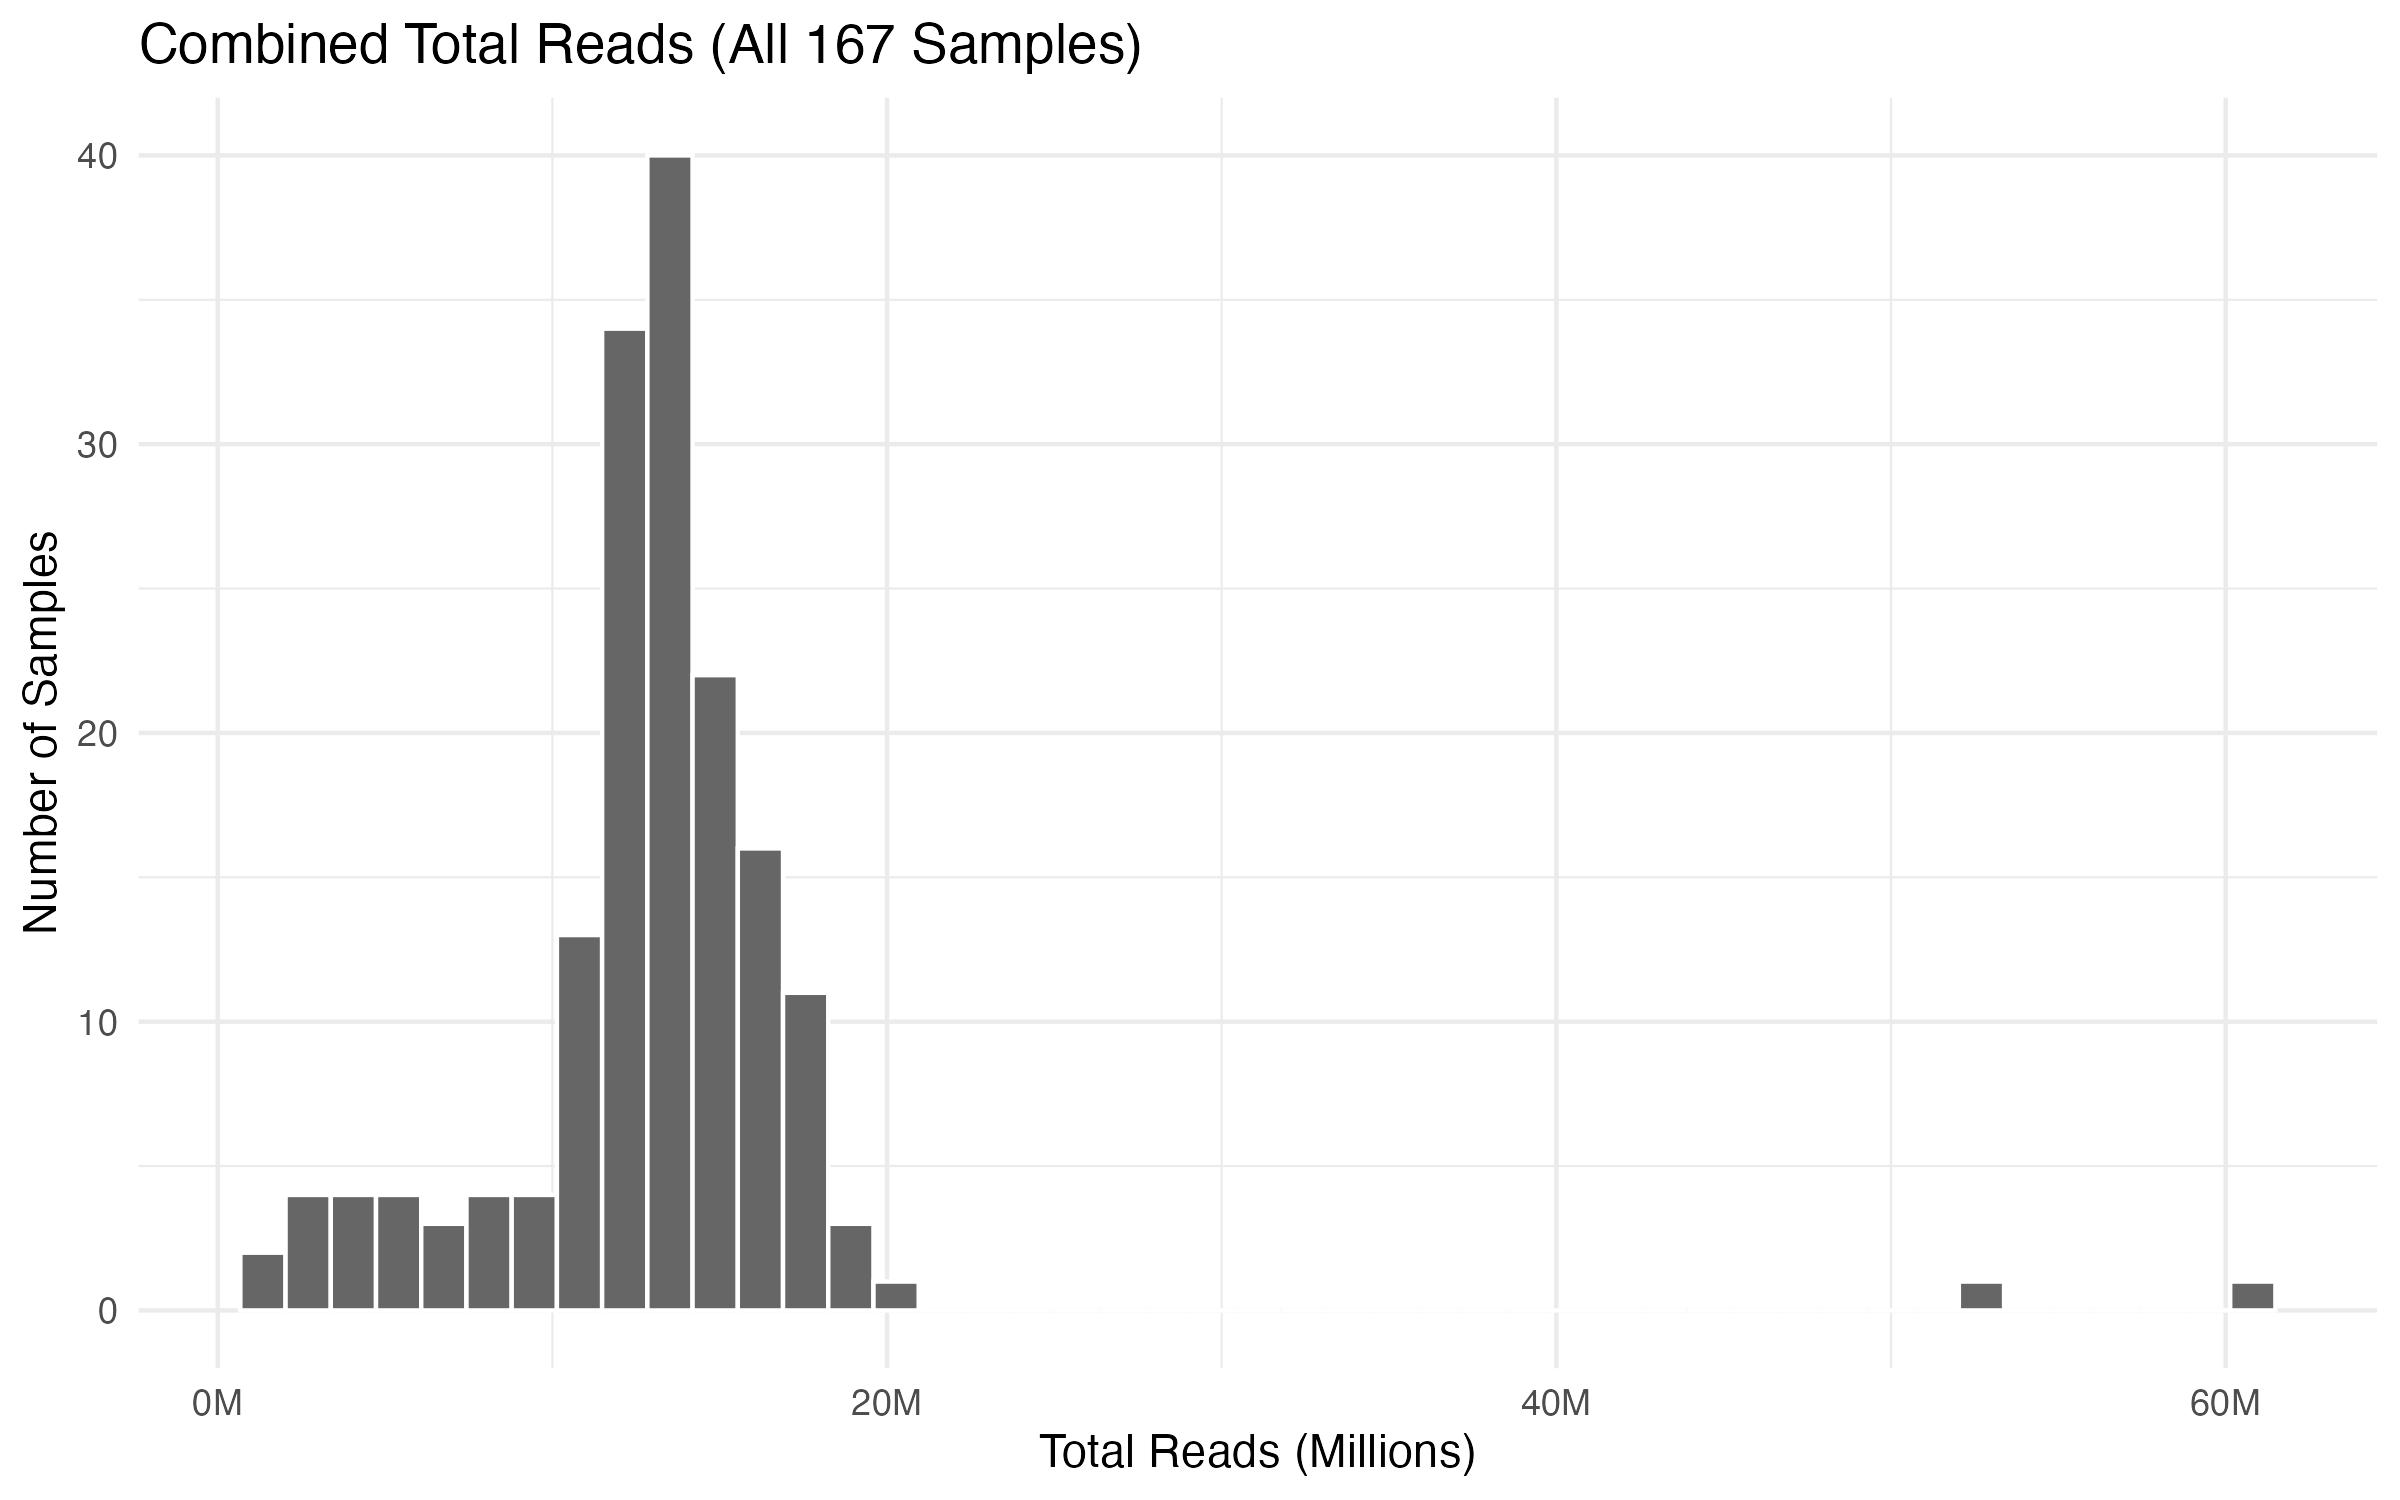
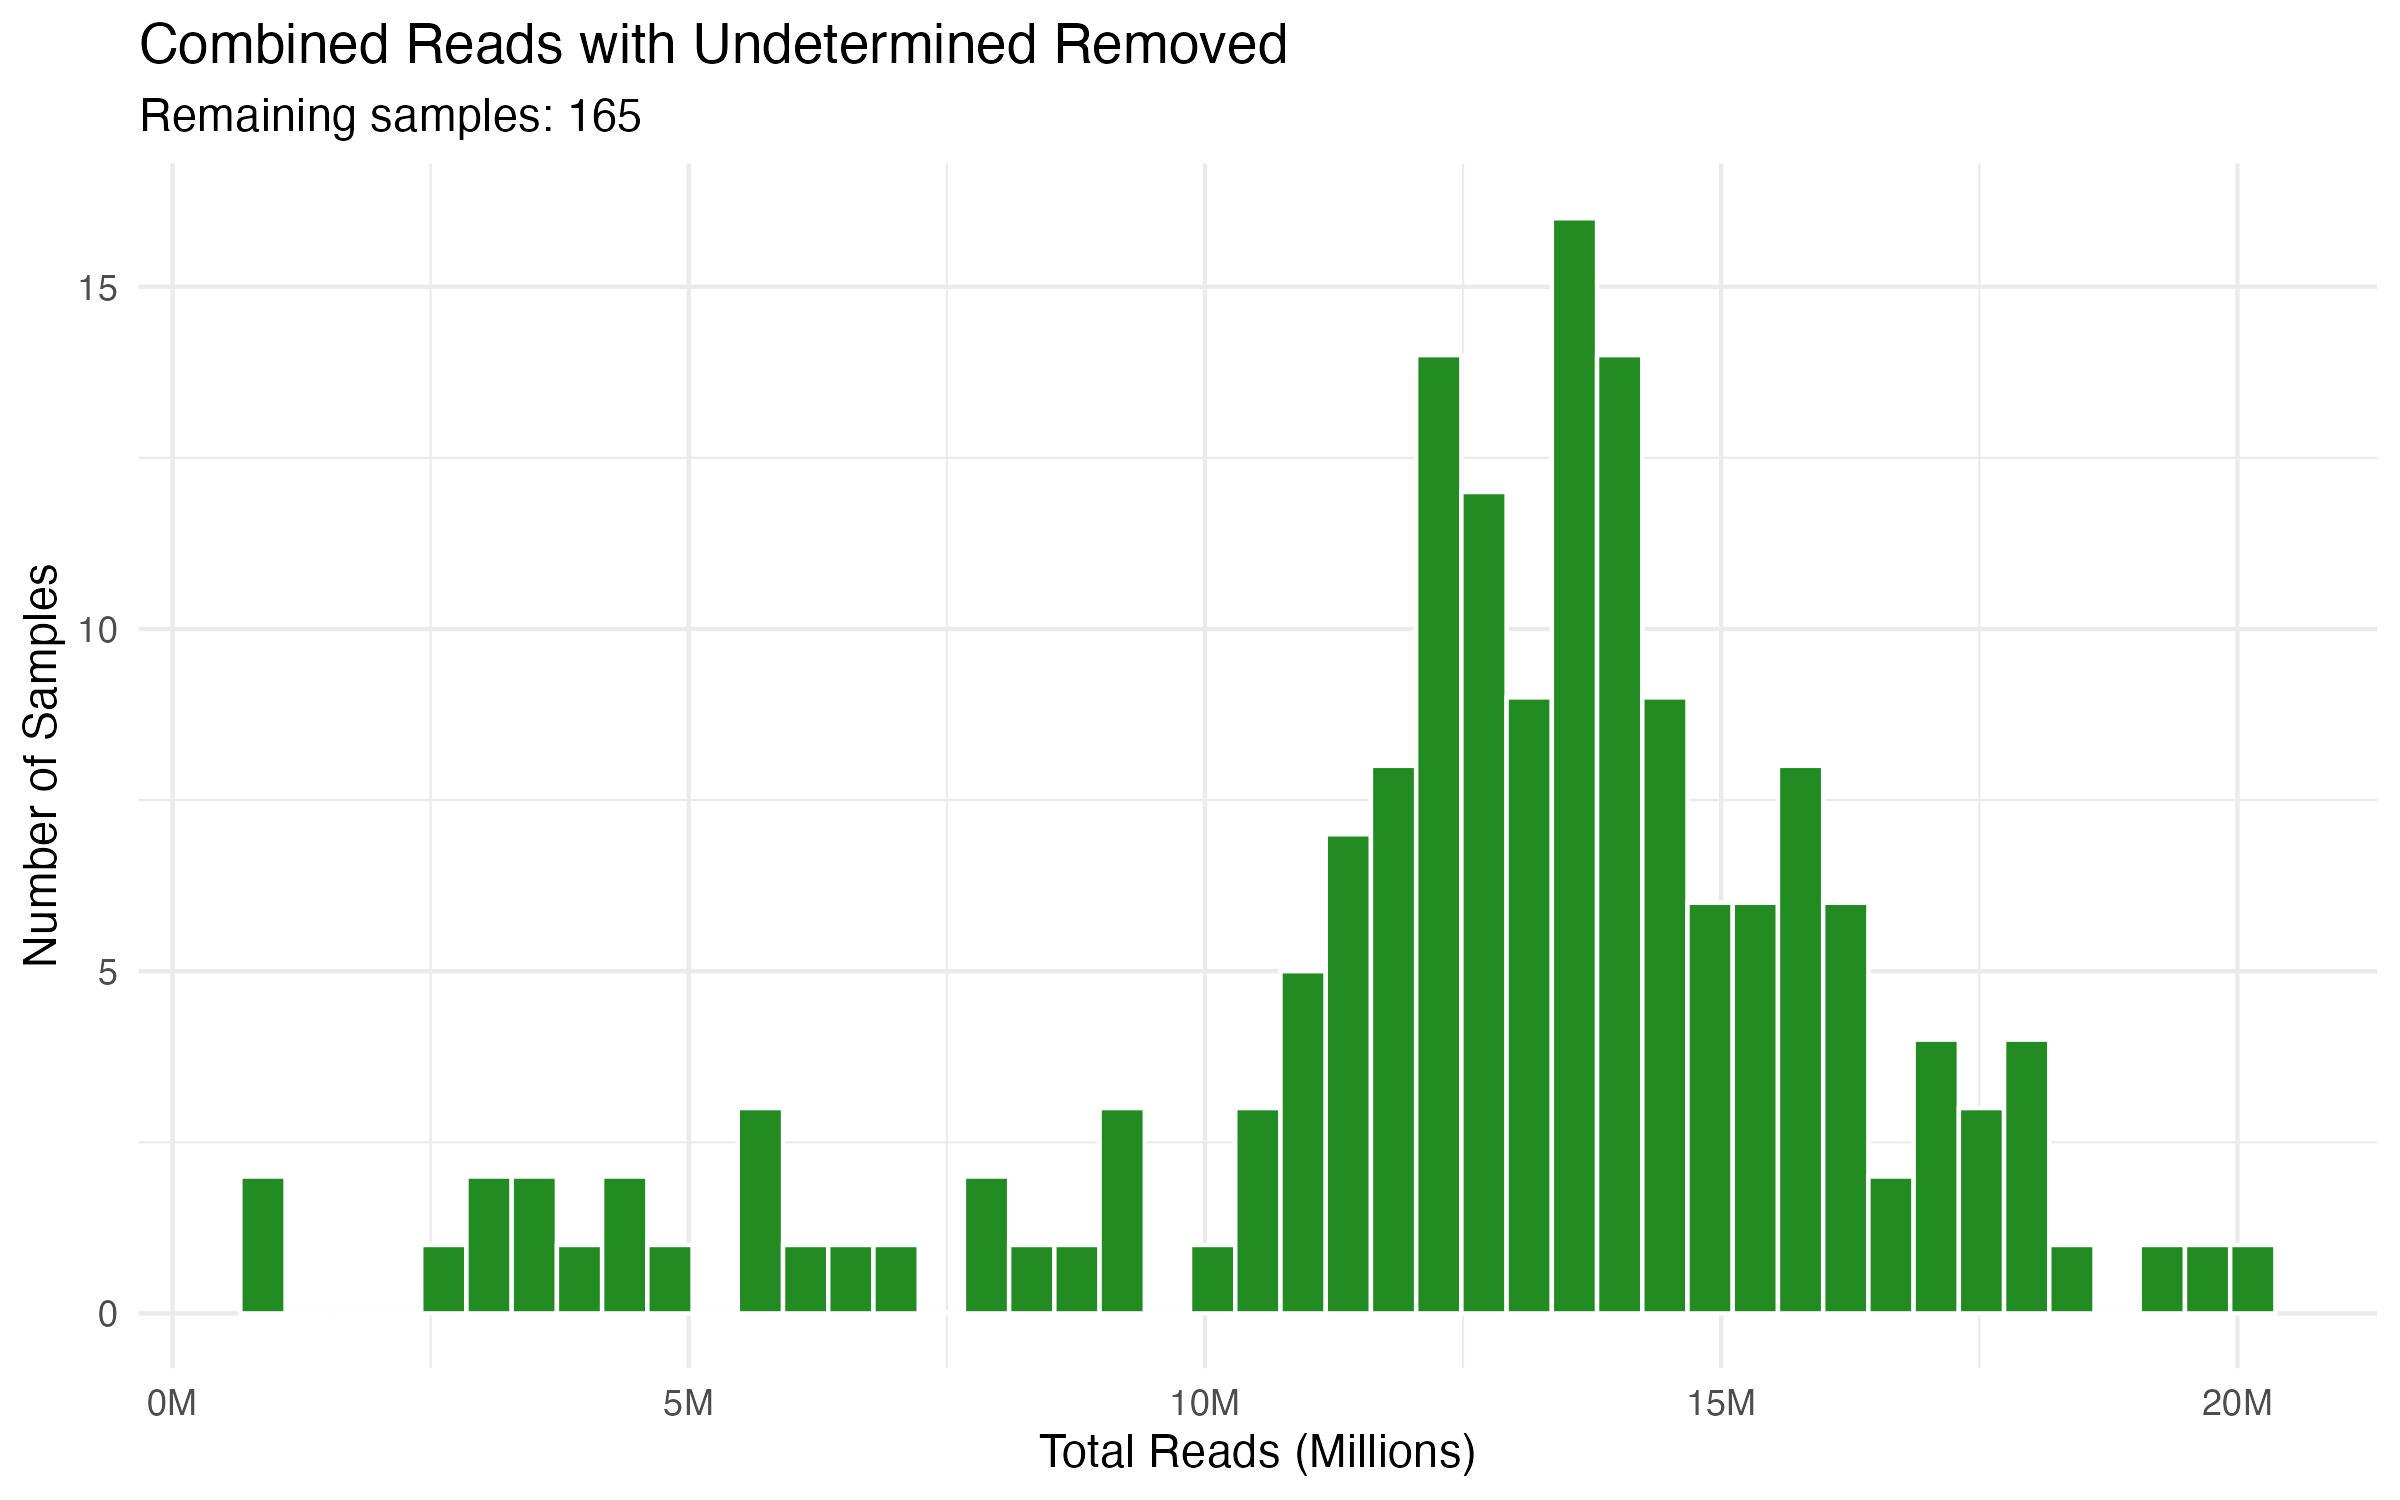
GOAL: We have 160+ columns of data.
It would be nice to see a distribution of how many reads we have per sample.
Let's pull the salmon counts table in R.
And then look up ways we can summarize this, i.e., distribution curve, etc.....