Details
-
Type:
Story
-
Status: Closed (View Workflow)
-
Priority:
 Major
Major
-
Resolution: Done
-
Affects Version/s: None
-
Fix Version/s: None
-
Labels:None
-
Story Points:12
-
Epic Link:
-
Sprint:Summer 2019 Sprint 12, Fall 2019 Sprint 1, Fall 2019 Sprint 2, Fall 2019 Sprint 3, Fall 4 : 30 Sep to 11 Oct, Fall 5 : 14 Oct to 25 Oct, Fall 6 : 28 Oct to 8 Nov
Description
In genomics we deal with very large files that associate numbers or features with genomic ranges.
Often these files get large - 10 Gb or bigger - with many millions of features.
Getting useful overviews of all these data is challenging. Current state of the art are so-called "coverage graphs" that plot the number of features per genomic base and display them as graphs in genome browser tracks. Some genome browsers (like IGB) can calculate these graphs "on the fly" after loading alignments (BAM files) into memory.
Large genome-based files are sorted by sequence name and genomic position and then indexed to facilitate efficient loading of data from specific regions of the genome into genome browsers. For example BAM files have indexes called BAI files, which map locations in the genome to locations in the file. Tab-delimited file formats like BED and GFF can have indexes called TBI files. Bigwig and Bigbed files formats have indexes written at the top of the file.
Back in 2011, Dr. Loraine had the idea to use the index files themselves as a summary of the larger file to give users an overview of the distribution of data in the larger file.
At the time, we were collaborating with Michael Lawrence of Genentech. We did a little work on it, but eventually dropped it in favor of other things.
Recently, a new paper was published from Aaron Quinlan's group that developed this idea further. Dr. Loraine saw a tweet about the article, recalled that she had thought of something similar many years before, and contacted Michael about it.
He then pointed her to some code he and his Bioconductor collaborators had implemented that also explored the idea.
I think it's time to re-visit this idea because in the interim, whole genome sequencing as a way to diagnose genetic problems has become much more practical. Let's jump back on it and see where it takes us!
References:
- Emails, notes: https://www.dropbox.com/sh/2sdv6k7k4s2lso5/AAAO1zcMb-pRqOz5iEMh7rX4a
- New paper: https://academic.oup.com/gigascience/article/6/11/gix090/4160383
- R implementation https://github.com/jorainer/biovizBase/blob/master/R/coverage.R
Goal:
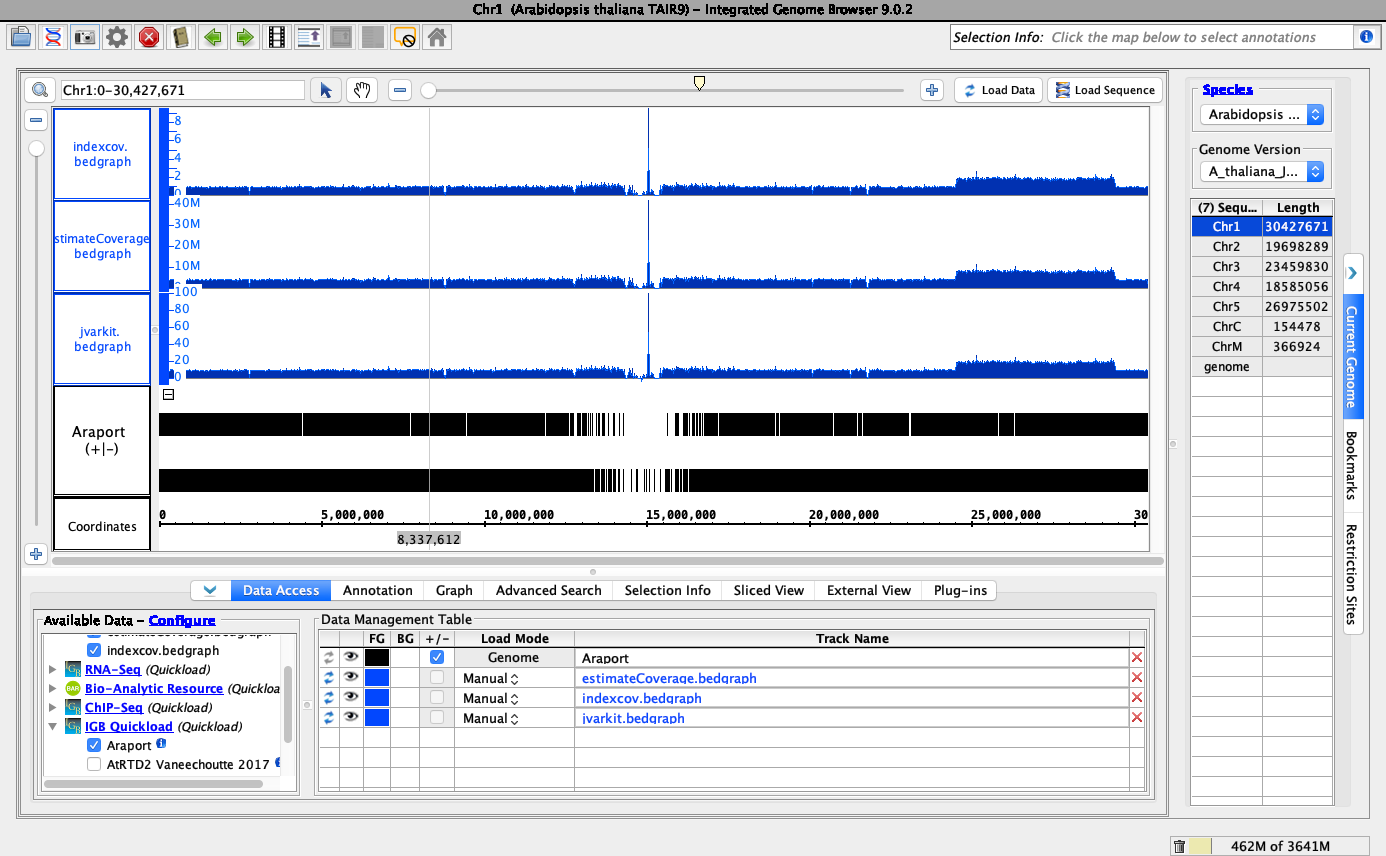
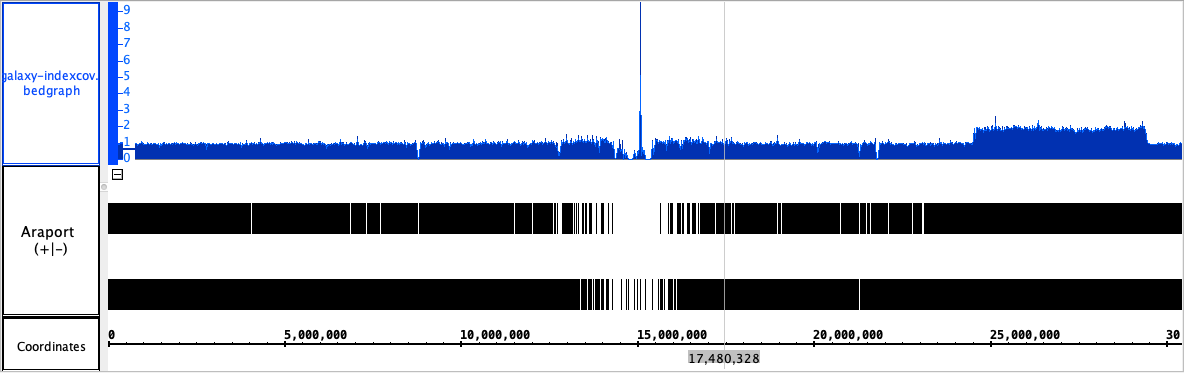
- Using one of the above tools, create BED or bigwig file from a BAI file and visualize in IGB
Compare to ordinary coverage graph:
- Performance - is it faster to load, less memory-intensive?
- Do we notice any new patterns not previously apparent?
Investigate:
- Can we implement a new file parser for bai index files in IGB?
Attachments
Issue Links
- relates to
-
IGBC-433 tbi/bai indexed semantic zoom is blank
-

- Closed
-
-
IGBF-2101 Produce Graph Sym from BAI
-

- Closed
-
-
-
- Closed
-
-
-
- Closed
-
-
-
- Testing Complete
-
-
IGBC-328 show .bai and .tbi index with geometric/log transform
-
- Closed
-
-
-
- Closed
-