Details
-
Type:
Task
-
Status: Closed (View Workflow)
-
Priority:
 Major
Major
-
Resolution: Done
-
Affects Version/s: None
-
Fix Version/s: None
-
Labels:None
-
Story Points:0.5
-
Epic Link:
-
Sprint:Spring 2 2022 Jan 18 - Jan 28
Description
University of Arizona researcher Dr. Cedar Warman is comparing data collected from two different library synthesis processes in which samples prepared by the U. of Az lab were compared to libraries made by a company - GeneWiz, combined, and then sequenced in a single lane.
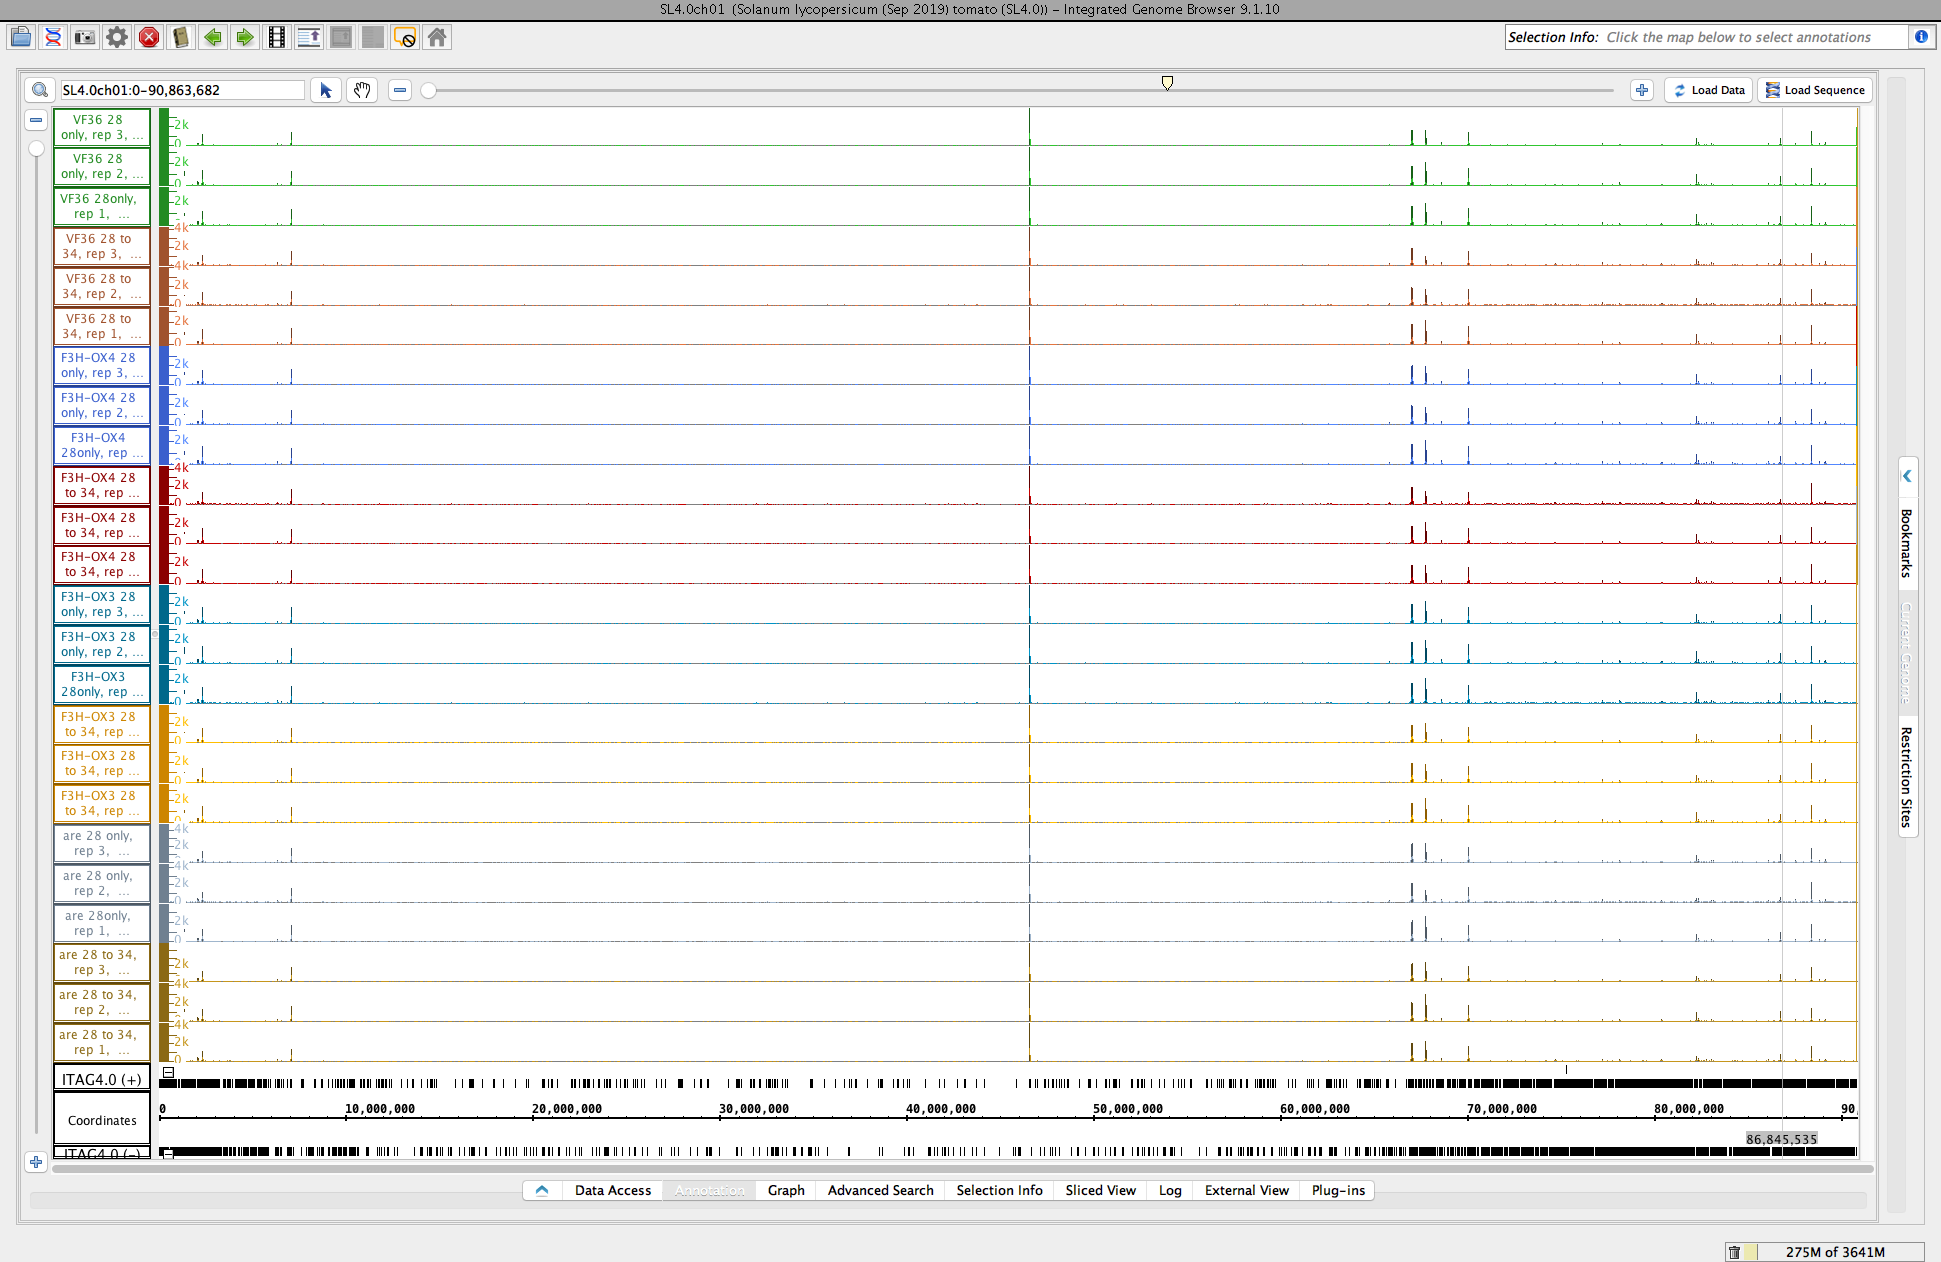
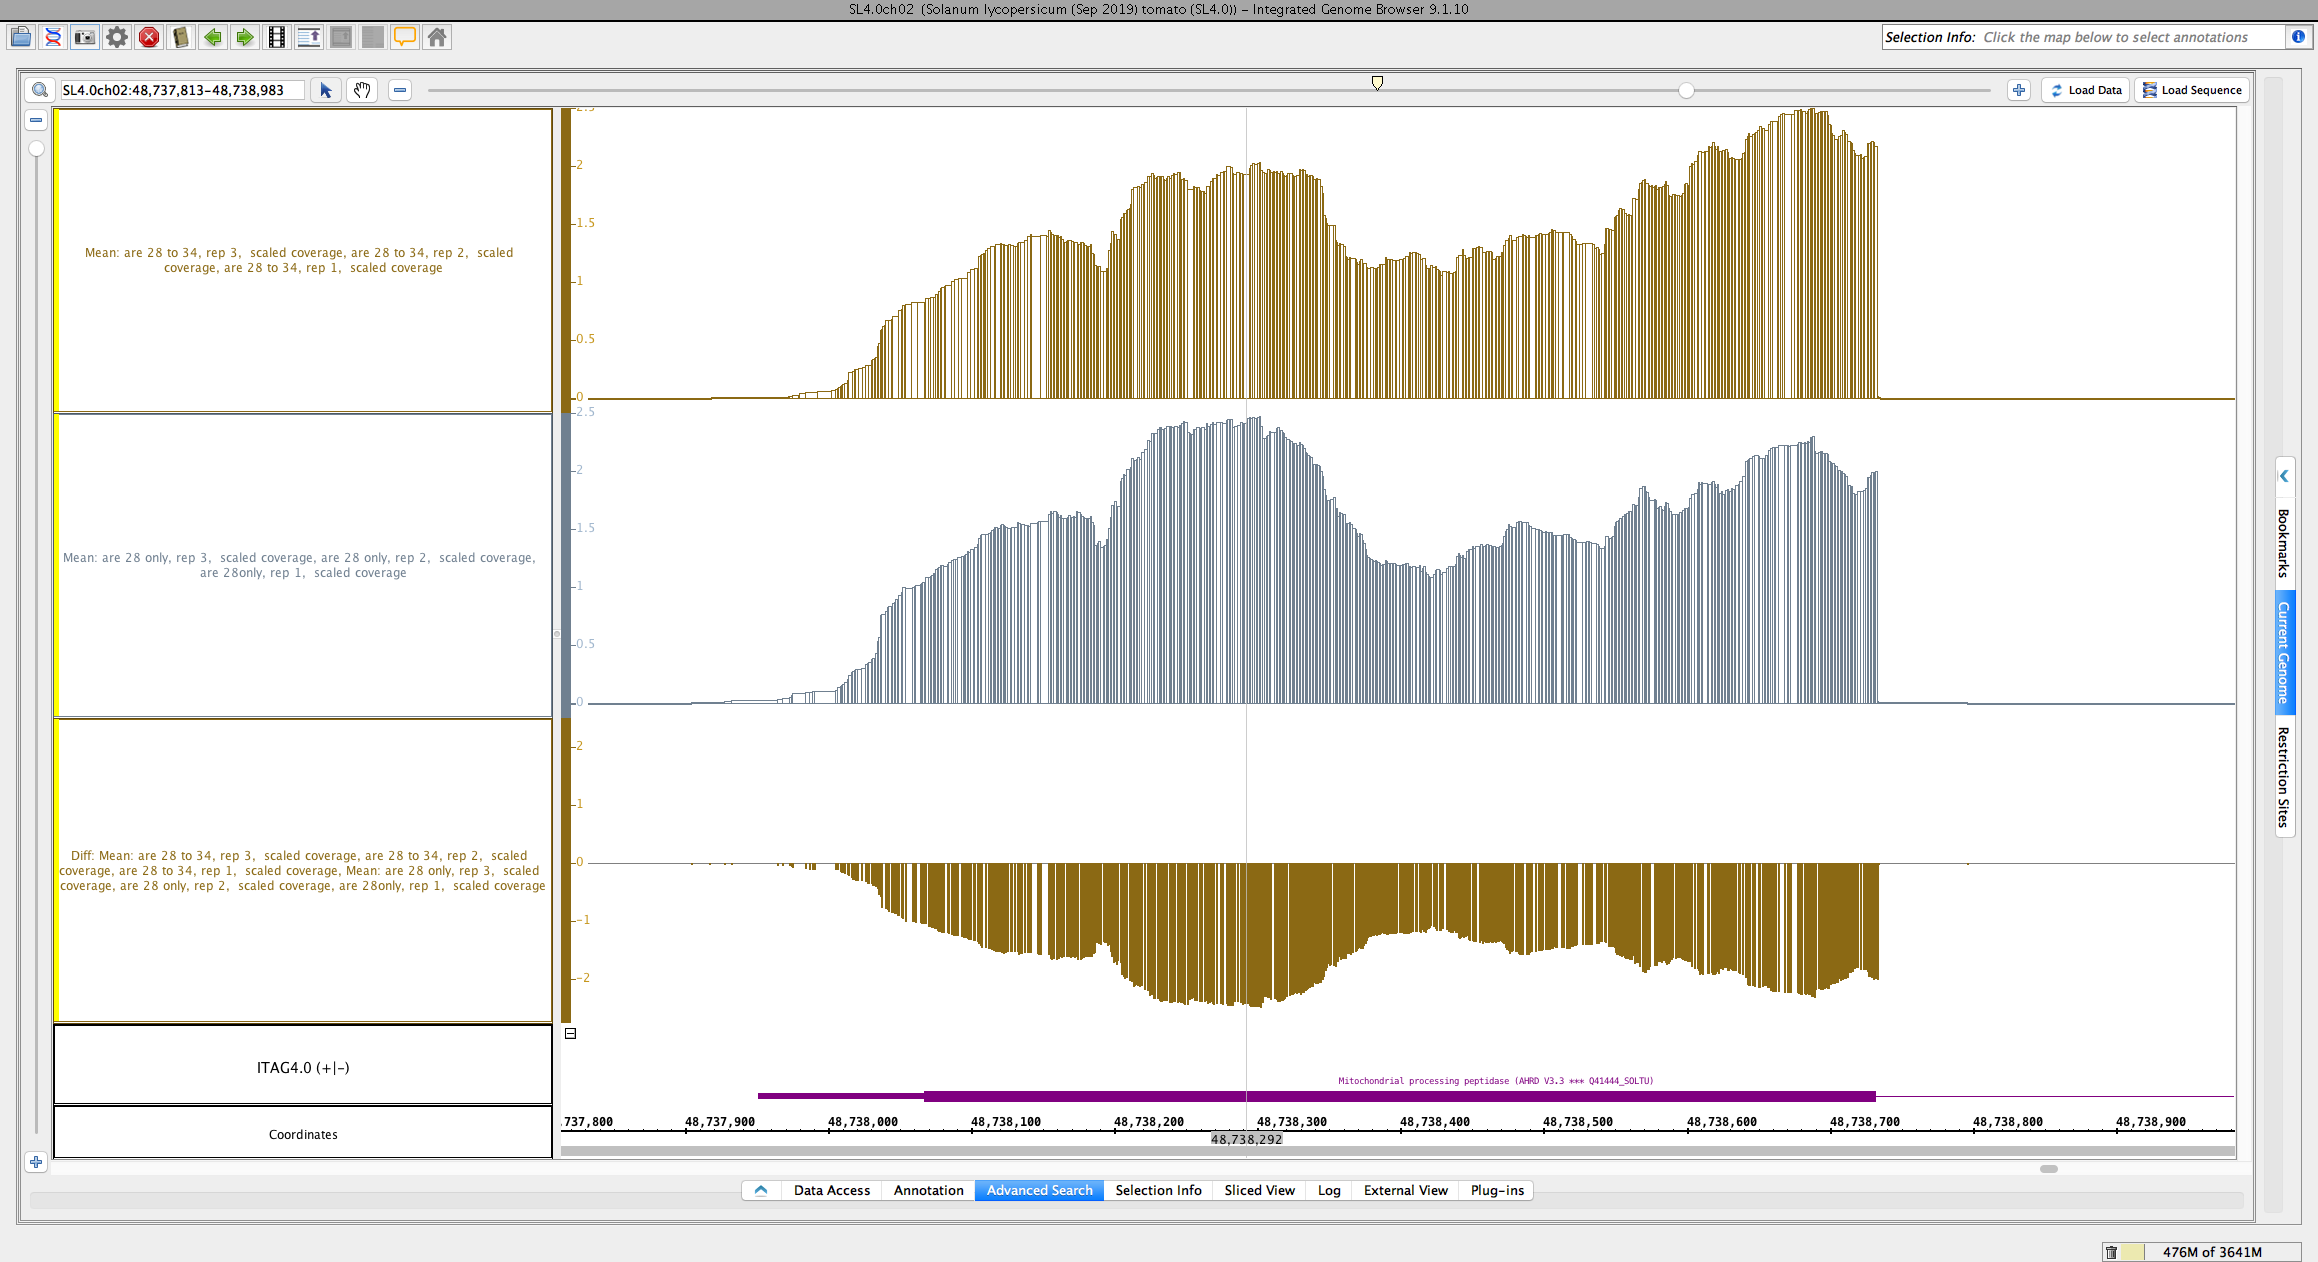
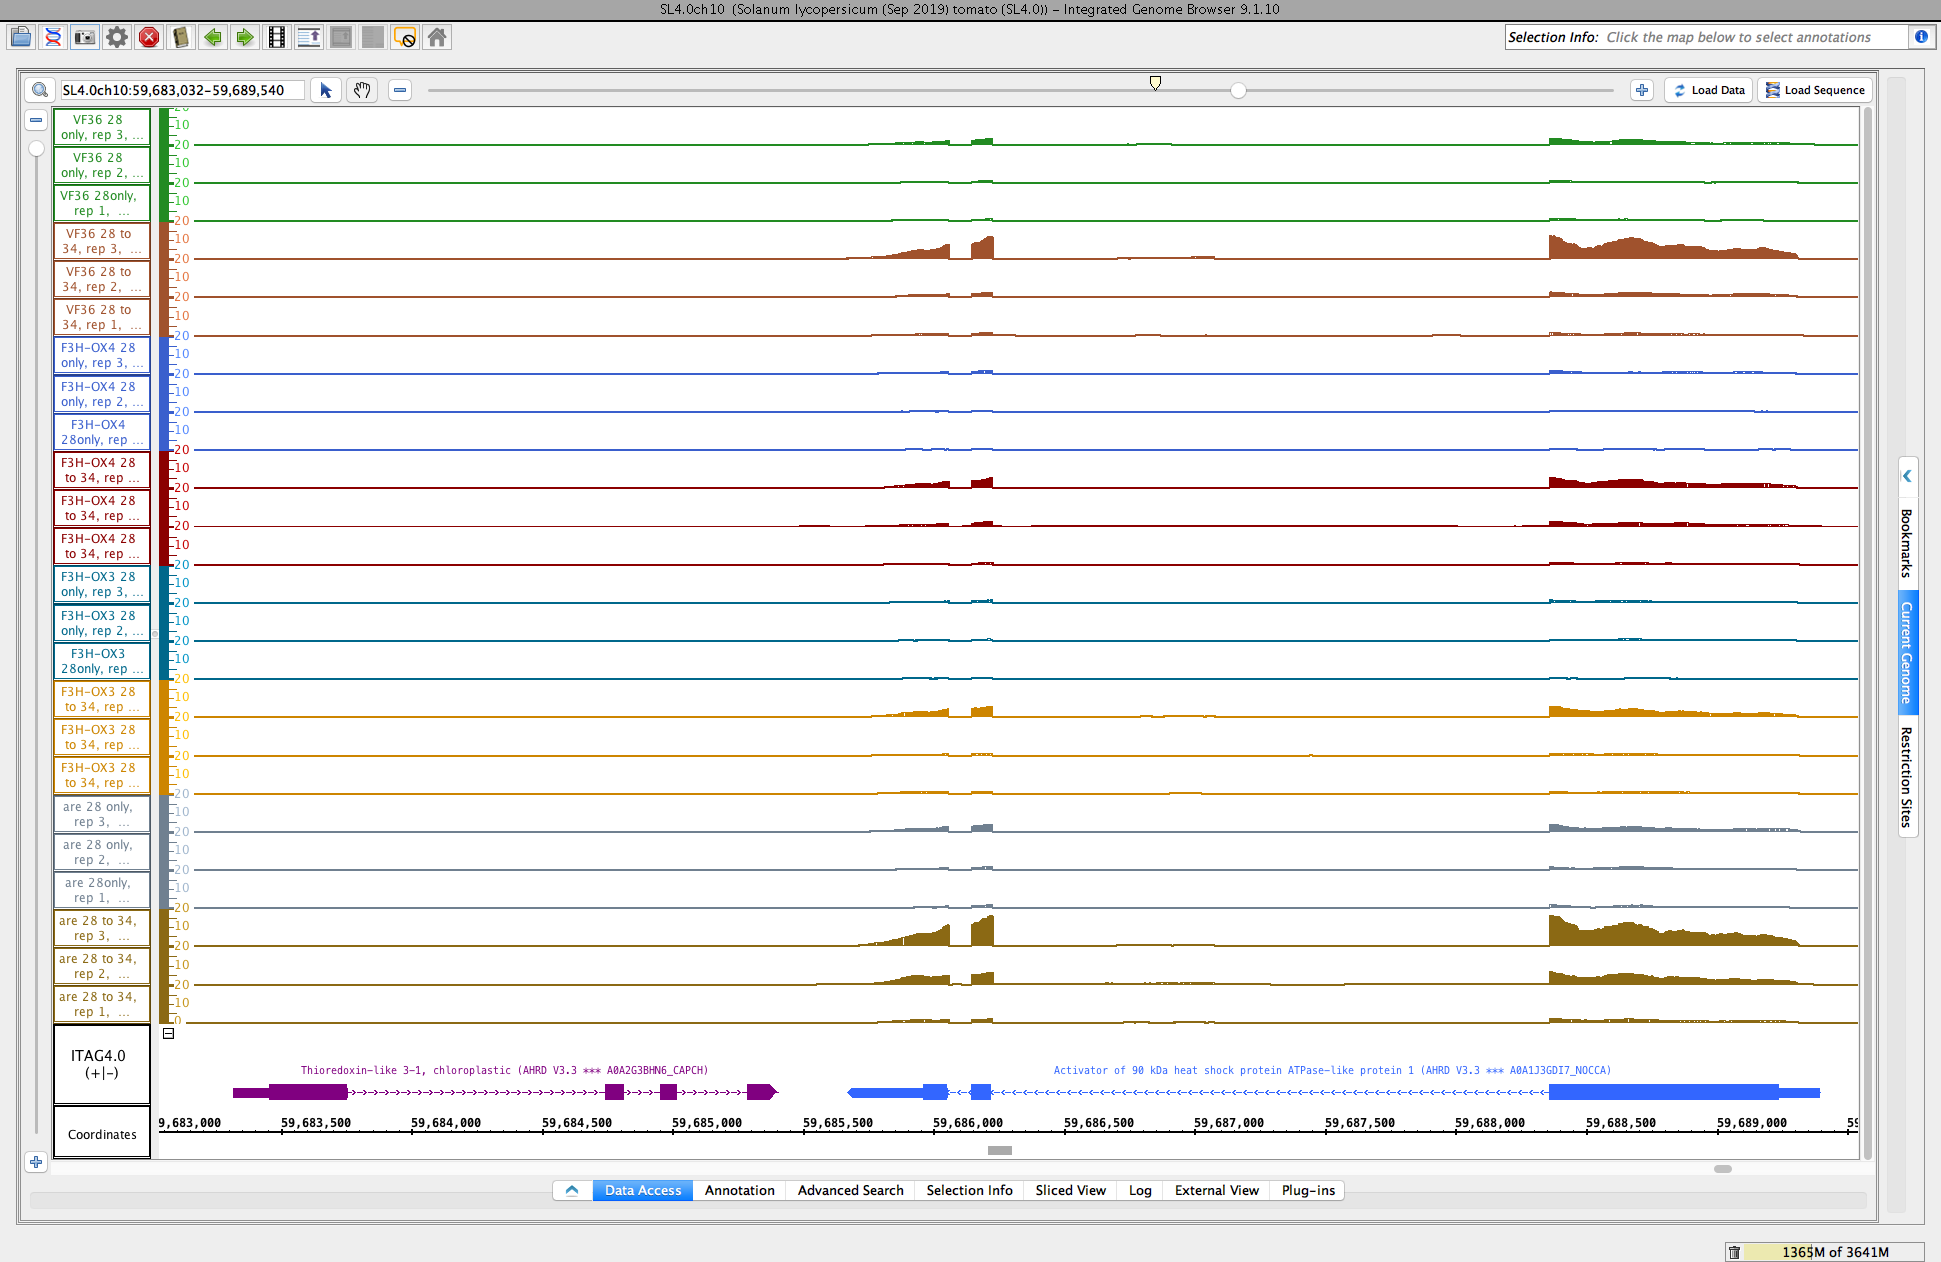
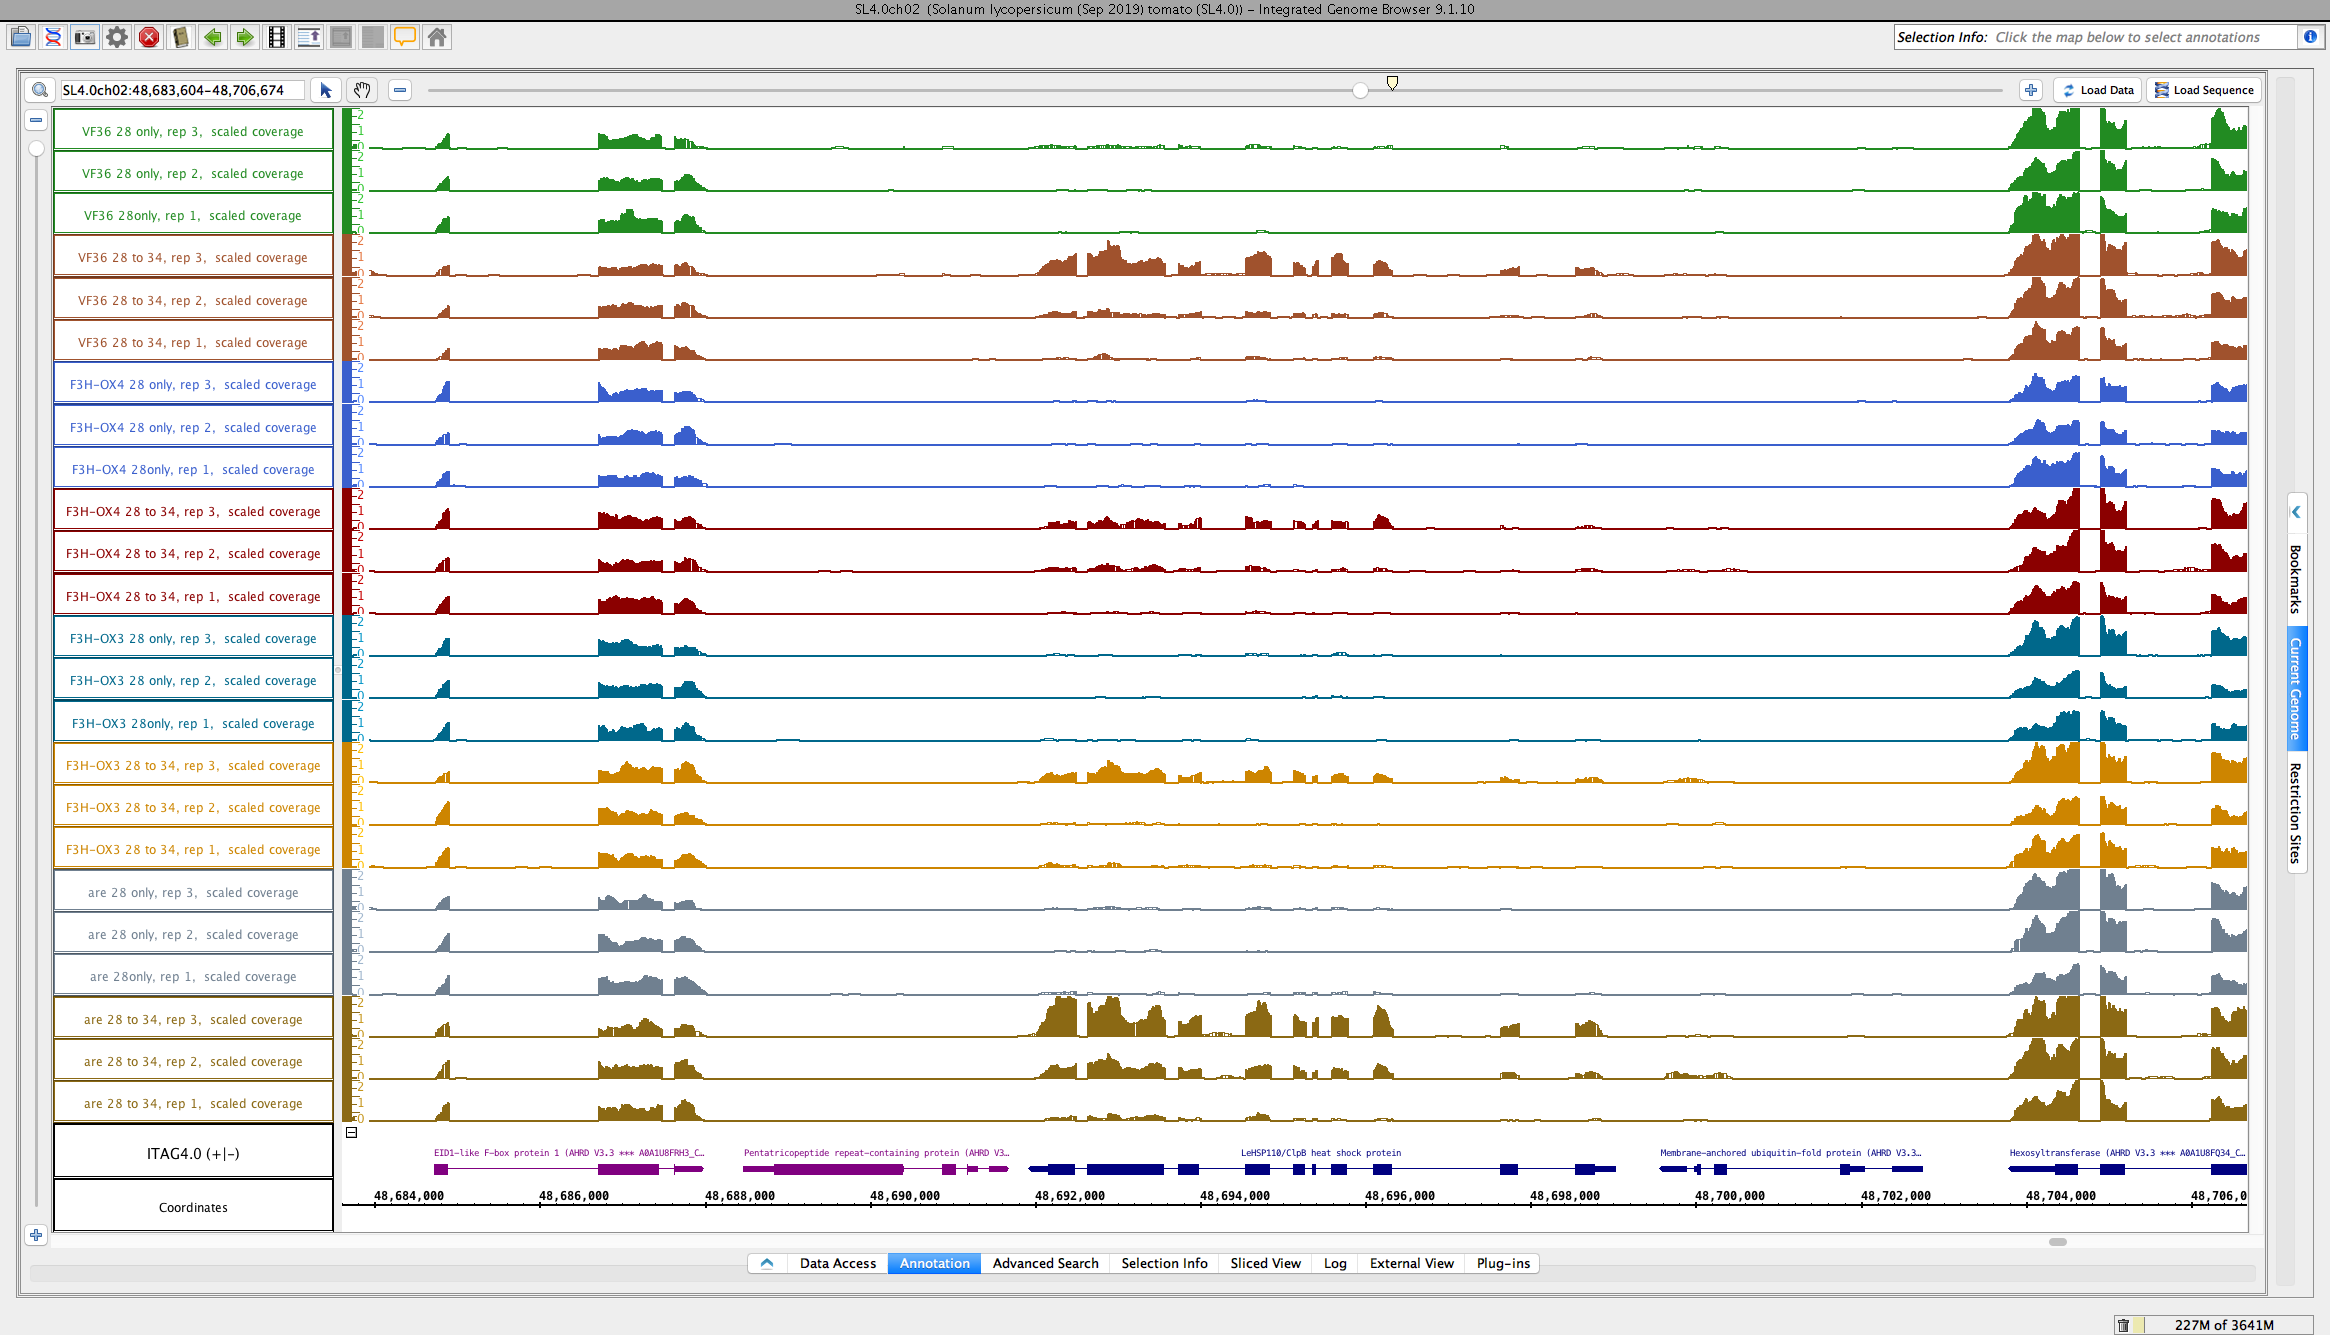
To analyze results, he has created genome coverage graphs using bamCoverage (deepTools).
For this task, we will set up an on-line call to show relevant features in IGB, mainly graph manipulation methods, that could help him analyze his data. During the zoom call, we will try to highlight ways that visualization can expose interesting features in data and even suggest better ways to analyze the data.
Note that there are a million and one ways to perform statistical analysis of data, i.e., there are many models that can be used. Selecting the right model for one's own data requires data exploration, to gain understanding of one's data and to notice salient properties. For genomic data, one of the most effective strategies for noticing salient features is to interactively view and explore the data in a genome browser such as IGB.
Attachments
Issue Links
- relates to
-
-
- Closed
-
Activity
| Field | Original Value | New Value |
|---|---|---|
| Epic Link | IGBF-2993 [ 21429 ] |
| Summary | Help CW with IGB | Explain IGB graph features to project team member |
| Attachment | scaledcoveragegraphs-ARE-chr1-diff-problem.png [ 17079 ] | |
| Attachment | scaledcoveragegraphs-ARE-chr1-HS2.png [ 17080 ] | |
| Attachment | scaledcoveragegraphs-ARE-chr1-HS1.png [ 17081 ] | |
| Attachment | scaledcoveragegraphs-ARE-chr1-all.png [ 17082 ] |
| Status | To-Do [ 10305 ] | In Progress [ 3 ] |
| Status | In Progress [ 3 ] | Needs 1st Level Review [ 10005 ] |
| Assignee | Ann Loraine [ aloraine ] |
| Attachment | scaledcoveragegraphs-ARE-chr1-HS2.png [ 17080 ] |
| Attachment | scaledcoveragegraphs-ARE-chr1-HS2-2.png [ 17083 ] |
| Description |
University of Arizona Dr. Cedar Warman is comparing data collected from two different library synthesis manufactures (GeneWiz and local U of Az, Palanivelu lab).
He has created genome covererage graphs using bamCoverage (deepTools). For this task, we give him a brief demonstration of graph manipulation methods in IGB, highlighting ways that visualization may show problems with or interesting features in data. |
University of Arizona researcher Dr. Cedar Warman is comparing data collected from two different library synthesis processes in which samples prepared by the U. of Az lab were compared to libraries made by a company - GeneWiz, combined, and then sequenced in a single lane.
To analyze results, he has created genome covererage graphs using bamCoverage (deepTools). For this task, we organize a zoom call and show features in IGB, mainly graph manipulation methods, that could help him analyze his data. During the zoom call, we will try to highlight ways that visualization can expose interesting features in data and even suggest better ways to analyze the data. Note that there are a million and one ways to perform statistical analysis of data, i.e., there are many models that can be used. Selecting the right model for one's own data requires extensive data exploration, and this includes simply looking at, and interacting with, data in a genome browser such as IGB. |
| Description |
University of Arizona researcher Dr. Cedar Warman is comparing data collected from two different library synthesis processes in which samples prepared by the U. of Az lab were compared to libraries made by a company - GeneWiz, combined, and then sequenced in a single lane.
To analyze results, he has created genome covererage graphs using bamCoverage (deepTools). For this task, we organize a zoom call and show features in IGB, mainly graph manipulation methods, that could help him analyze his data. During the zoom call, we will try to highlight ways that visualization can expose interesting features in data and even suggest better ways to analyze the data. Note that there are a million and one ways to perform statistical analysis of data, i.e., there are many models that can be used. Selecting the right model for one's own data requires extensive data exploration, and this includes simply looking at, and interacting with, data in a genome browser such as IGB. |
University of Arizona researcher Dr. Cedar Warman is comparing data collected from two different library synthesis processes in which samples prepared by the U. of Az lab were compared to libraries made by a company - GeneWiz, combined, and then sequenced in a single lane.
To analyze results, he has created genome covererage graphs using bamCoverage (deepTools). For this task, we will set up an on-line call to show relevant features in IGB, mainly graph manipulation methods, that could help him analyze his data. During the zoom call, we will try to highlight ways that visualization can expose interesting features in data and even suggest better ways to analyze the data. Note that there are a million and one ways to perform statistical analysis of data, i.e., there are many models that can be used. Selecting the right model for one's own data requires extensive data exploration, and this includes simply looking at, and interacting with, data in a genome browser such as IGB. |
| Description |
University of Arizona researcher Dr. Cedar Warman is comparing data collected from two different library synthesis processes in which samples prepared by the U. of Az lab were compared to libraries made by a company - GeneWiz, combined, and then sequenced in a single lane.
To analyze results, he has created genome covererage graphs using bamCoverage (deepTools). For this task, we will set up an on-line call to show relevant features in IGB, mainly graph manipulation methods, that could help him analyze his data. During the zoom call, we will try to highlight ways that visualization can expose interesting features in data and even suggest better ways to analyze the data. Note that there are a million and one ways to perform statistical analysis of data, i.e., there are many models that can be used. Selecting the right model for one's own data requires extensive data exploration, and this includes simply looking at, and interacting with, data in a genome browser such as IGB. |
University of Arizona researcher Dr. Cedar Warman is comparing data collected from two different library synthesis processes in which samples prepared by the U. of Az lab were compared to libraries made by a company - GeneWiz, combined, and then sequenced in a single lane.
To analyze results, he has created genome covererage graphs using bamCoverage (deepTools). For this task, we will set up an on-line call to show relevant features in IGB, mainly graph manipulation methods, that could help him analyze his data. During the zoom call, we will try to highlight ways that visualization can expose interesting features in data and even suggest better ways to analyze the data. Note that there are a million and one ways to perform statistical analysis of data, i.e., there are many models that can be used. Selecting the right model for one's own data requires data exploration, to gain understanding of one's data and to notice salient properties. For genomic data, one of the most effective strategies for noticing salient features is to interactively view and explore the data in a genome browser such as IGB. |
| Status | Needs 1st Level Review [ 10005 ] | First Level Review in Progress [ 10301 ] |
| Status | First Level Review in Progress [ 10301 ] | Needs 1st Level Review [ 10005 ] |
| Status | Needs 1st Level Review [ 10005 ] | First Level Review in Progress [ 10301 ] |
| Status | First Level Review in Progress [ 10301 ] | Ready for Pull Request [ 10304 ] |
| Status | Ready for Pull Request [ 10304 ] | Pull Request Submitted [ 10101 ] |
| Status | Pull Request Submitted [ 10101 ] | Reviewing Pull Request [ 10303 ] |
| Status | Reviewing Pull Request [ 10303 ] | Merged Needs Testing [ 10002 ] |
| Status | Merged Needs Testing [ 10002 ] | Post-merge Testing In Progress [ 10003 ] |
| Resolution | Done [ 10000 ] | |
| Status | Post-merge Testing In Progress [ 10003 ] | Closed [ 6 ] |
| Assignee | Ann Loraine [ aloraine ] |
| Summary | Explain IGB graph features to project team member | Explain IGB graph features to project team |
| Description |
University of Arizona researcher Dr. Cedar Warman is comparing data collected from two different library synthesis processes in which samples prepared by the U. of Az lab were compared to libraries made by a company - GeneWiz, combined, and then sequenced in a single lane.
To analyze results, he has created genome covererage graphs using bamCoverage (deepTools). For this task, we will set up an on-line call to show relevant features in IGB, mainly graph manipulation methods, that could help him analyze his data. During the zoom call, we will try to highlight ways that visualization can expose interesting features in data and even suggest better ways to analyze the data. Note that there are a million and one ways to perform statistical analysis of data, i.e., there are many models that can be used. Selecting the right model for one's own data requires data exploration, to gain understanding of one's data and to notice salient properties. For genomic data, one of the most effective strategies for noticing salient features is to interactively view and explore the data in a genome browser such as IGB. |
University of Arizona researcher Dr. Cedar Warman is comparing data collected from two different library synthesis processes in which samples prepared by the U. of Az lab were compared to libraries made by a company - GeneWiz, combined, and then sequenced in a single lane.
To analyze results, he has created genome coverage graphs using bamCoverage (deepTools). For this task, we will set up an on-line call to show relevant features in IGB, mainly graph manipulation methods, that could help him analyze his data. During the zoom call, we will try to highlight ways that visualization can expose interesting features in data and even suggest better ways to analyze the data. Note that there are a million and one ways to perform statistical analysis of data, i.e., there are many models that can be used. Selecting the right model for one's own data requires data exploration, to gain understanding of one's data and to notice salient properties. For genomic data, one of the most effective strategies for noticing salient features is to interactively view and explore the data in a genome browser such as IGB. |