Details
-
Type:
Task
-
Status: Closed (View Workflow)
-
Priority:
 Major
Major
-
Resolution: Done
-
Affects Version/s: None
-
Fix Version/s: None
-
Labels:None
-
Story Points:0.5
-
Epic Link:
-
Sprint:Spring 2 2022 Jan 18 - Jan 28, Spring 3 2022 Jan 31 - Feb 11, Spring 4 2022 Feb 14 - Feb 25
Description
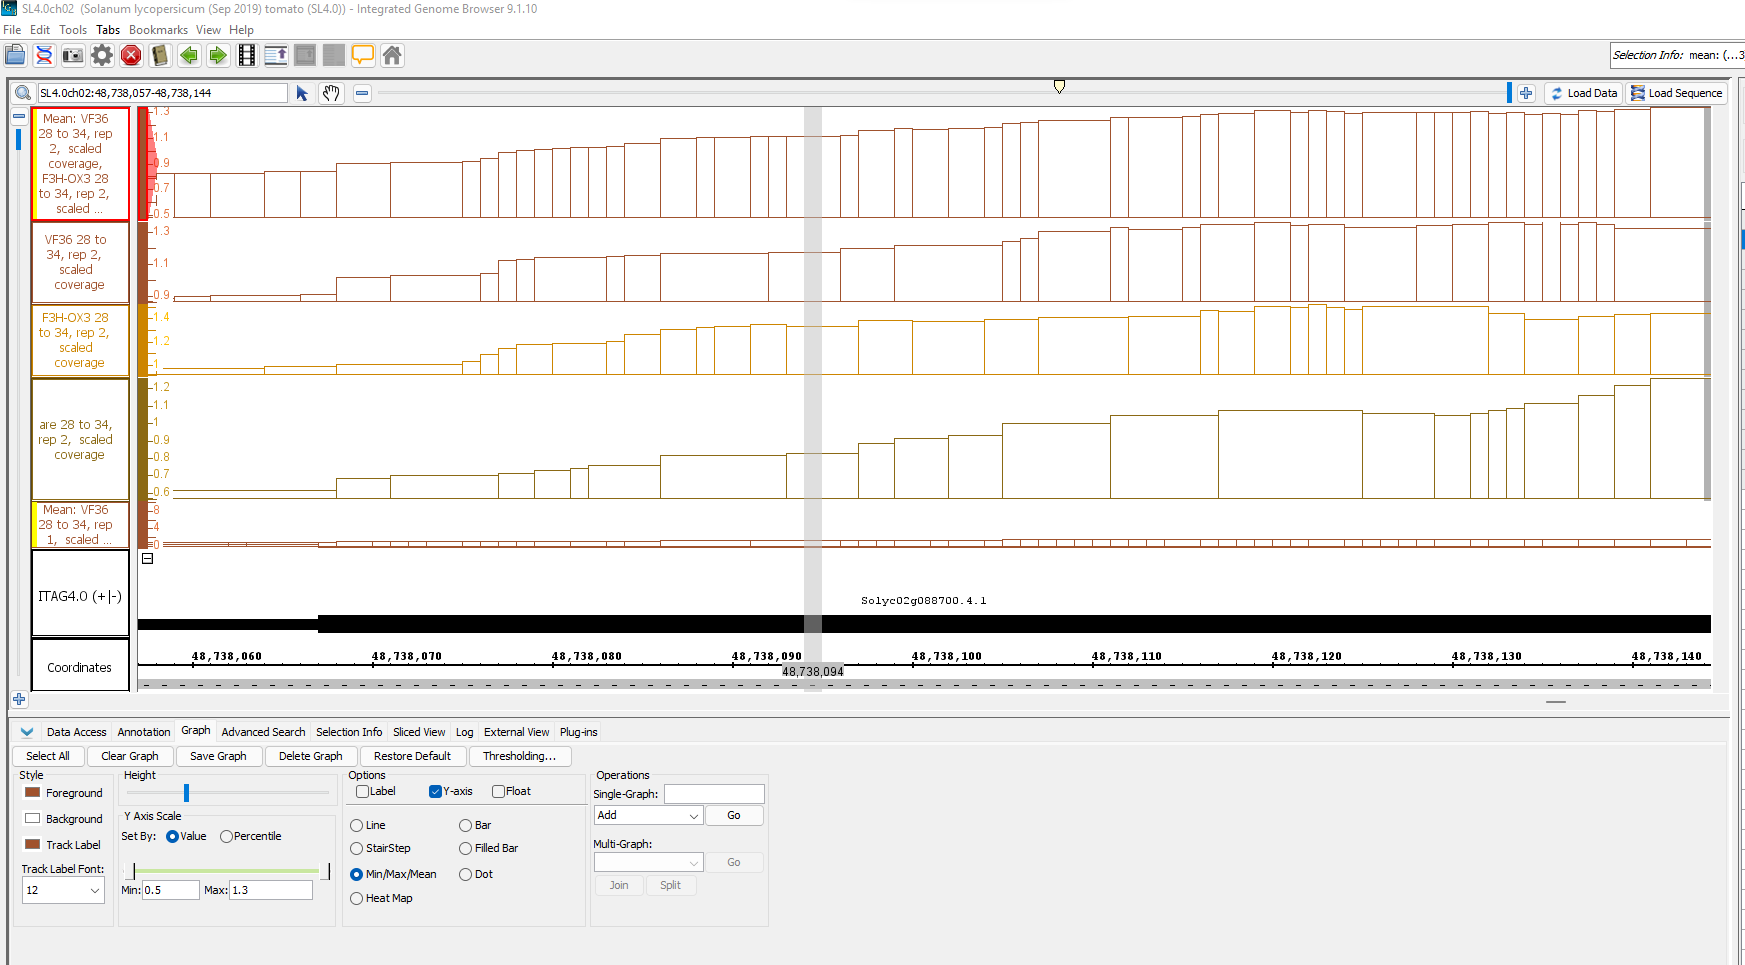
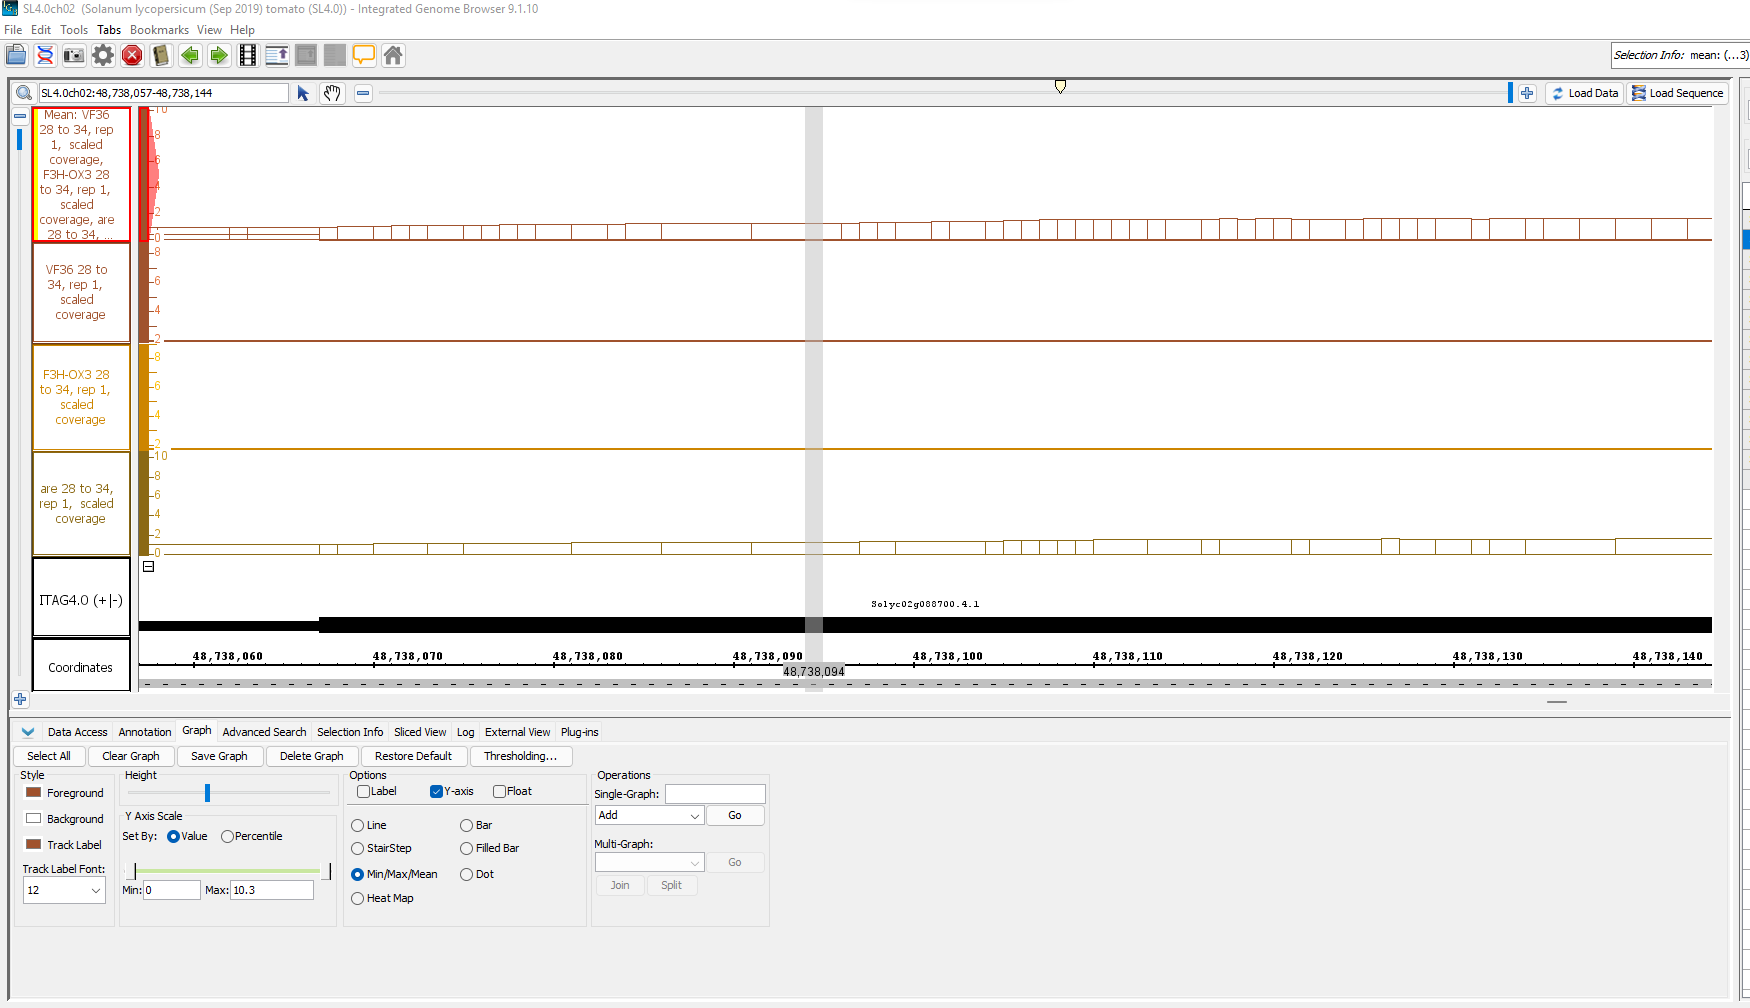
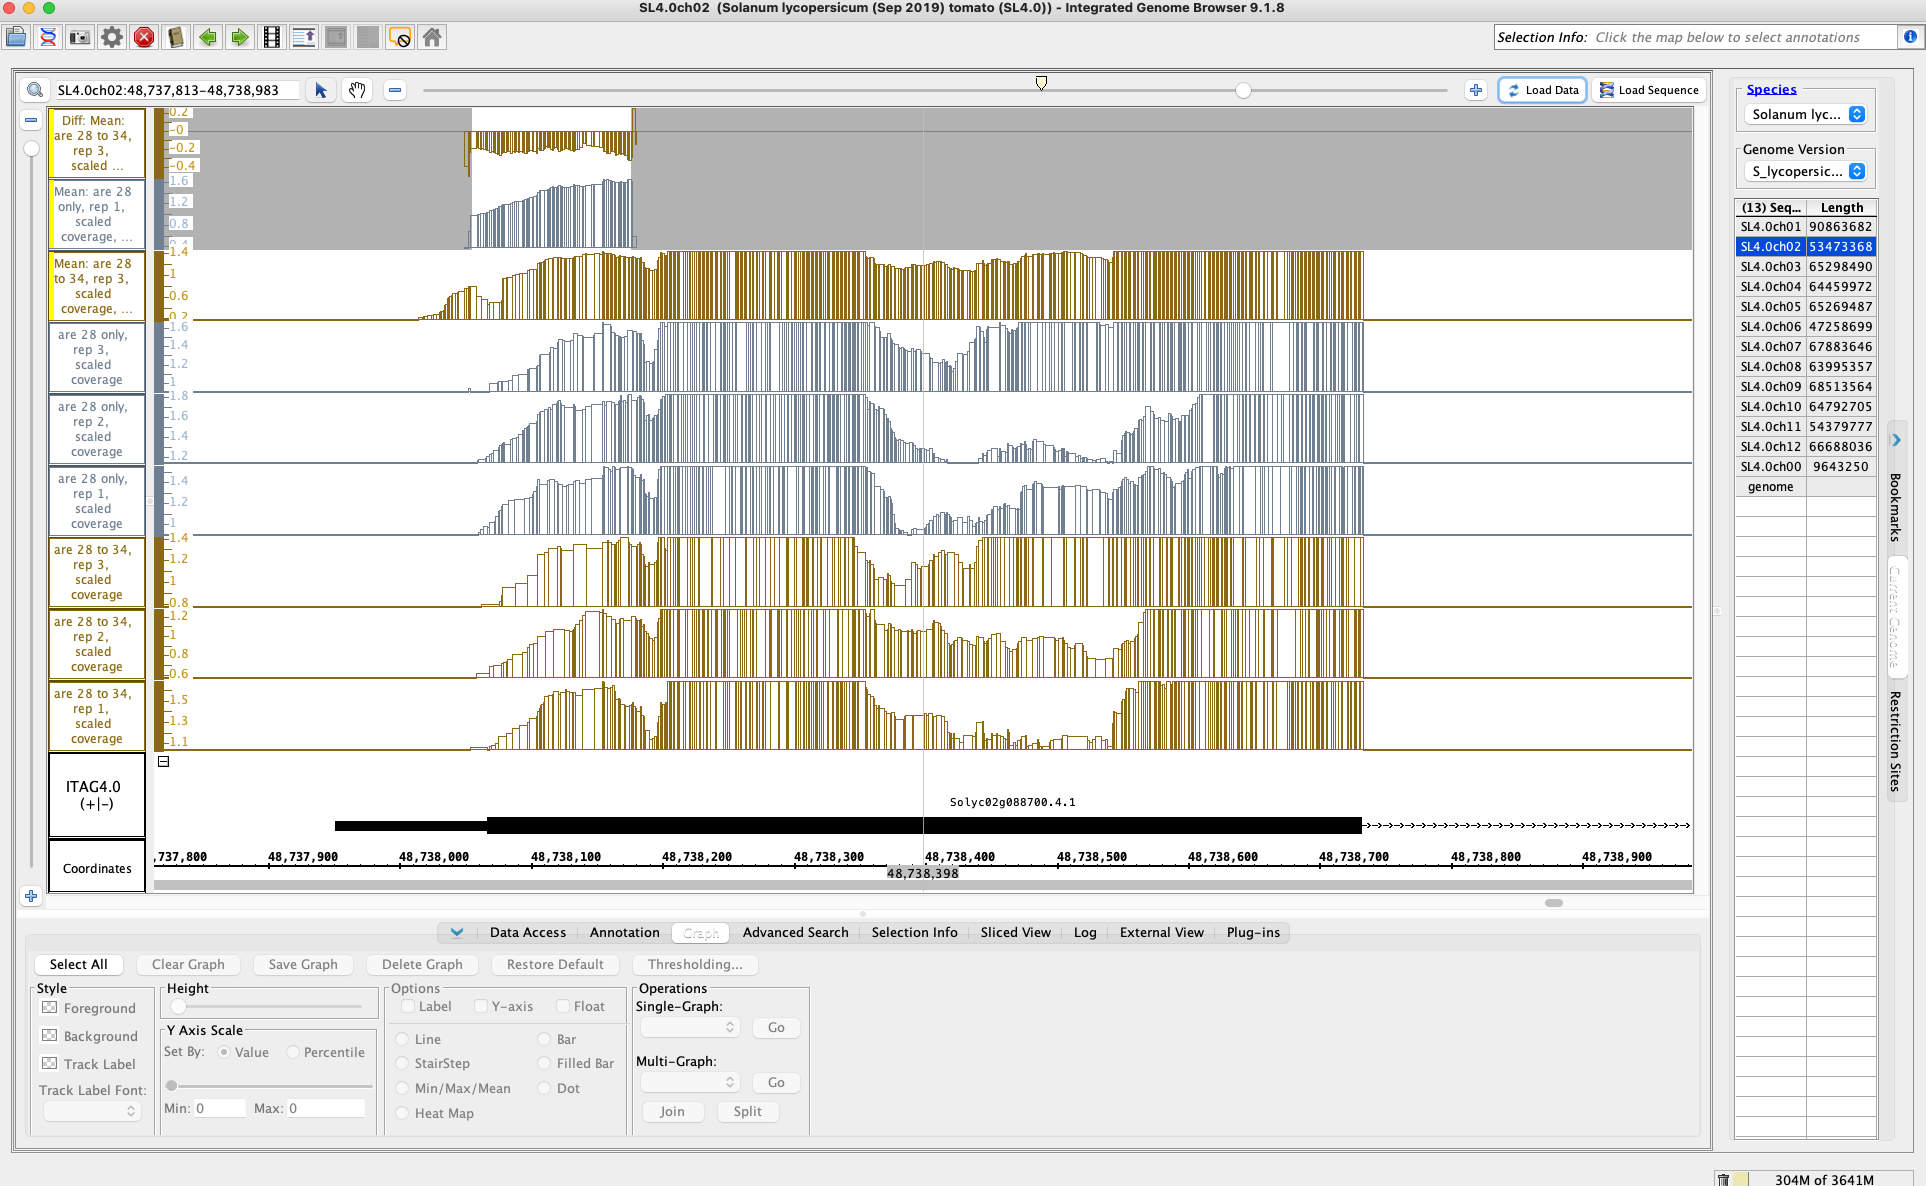
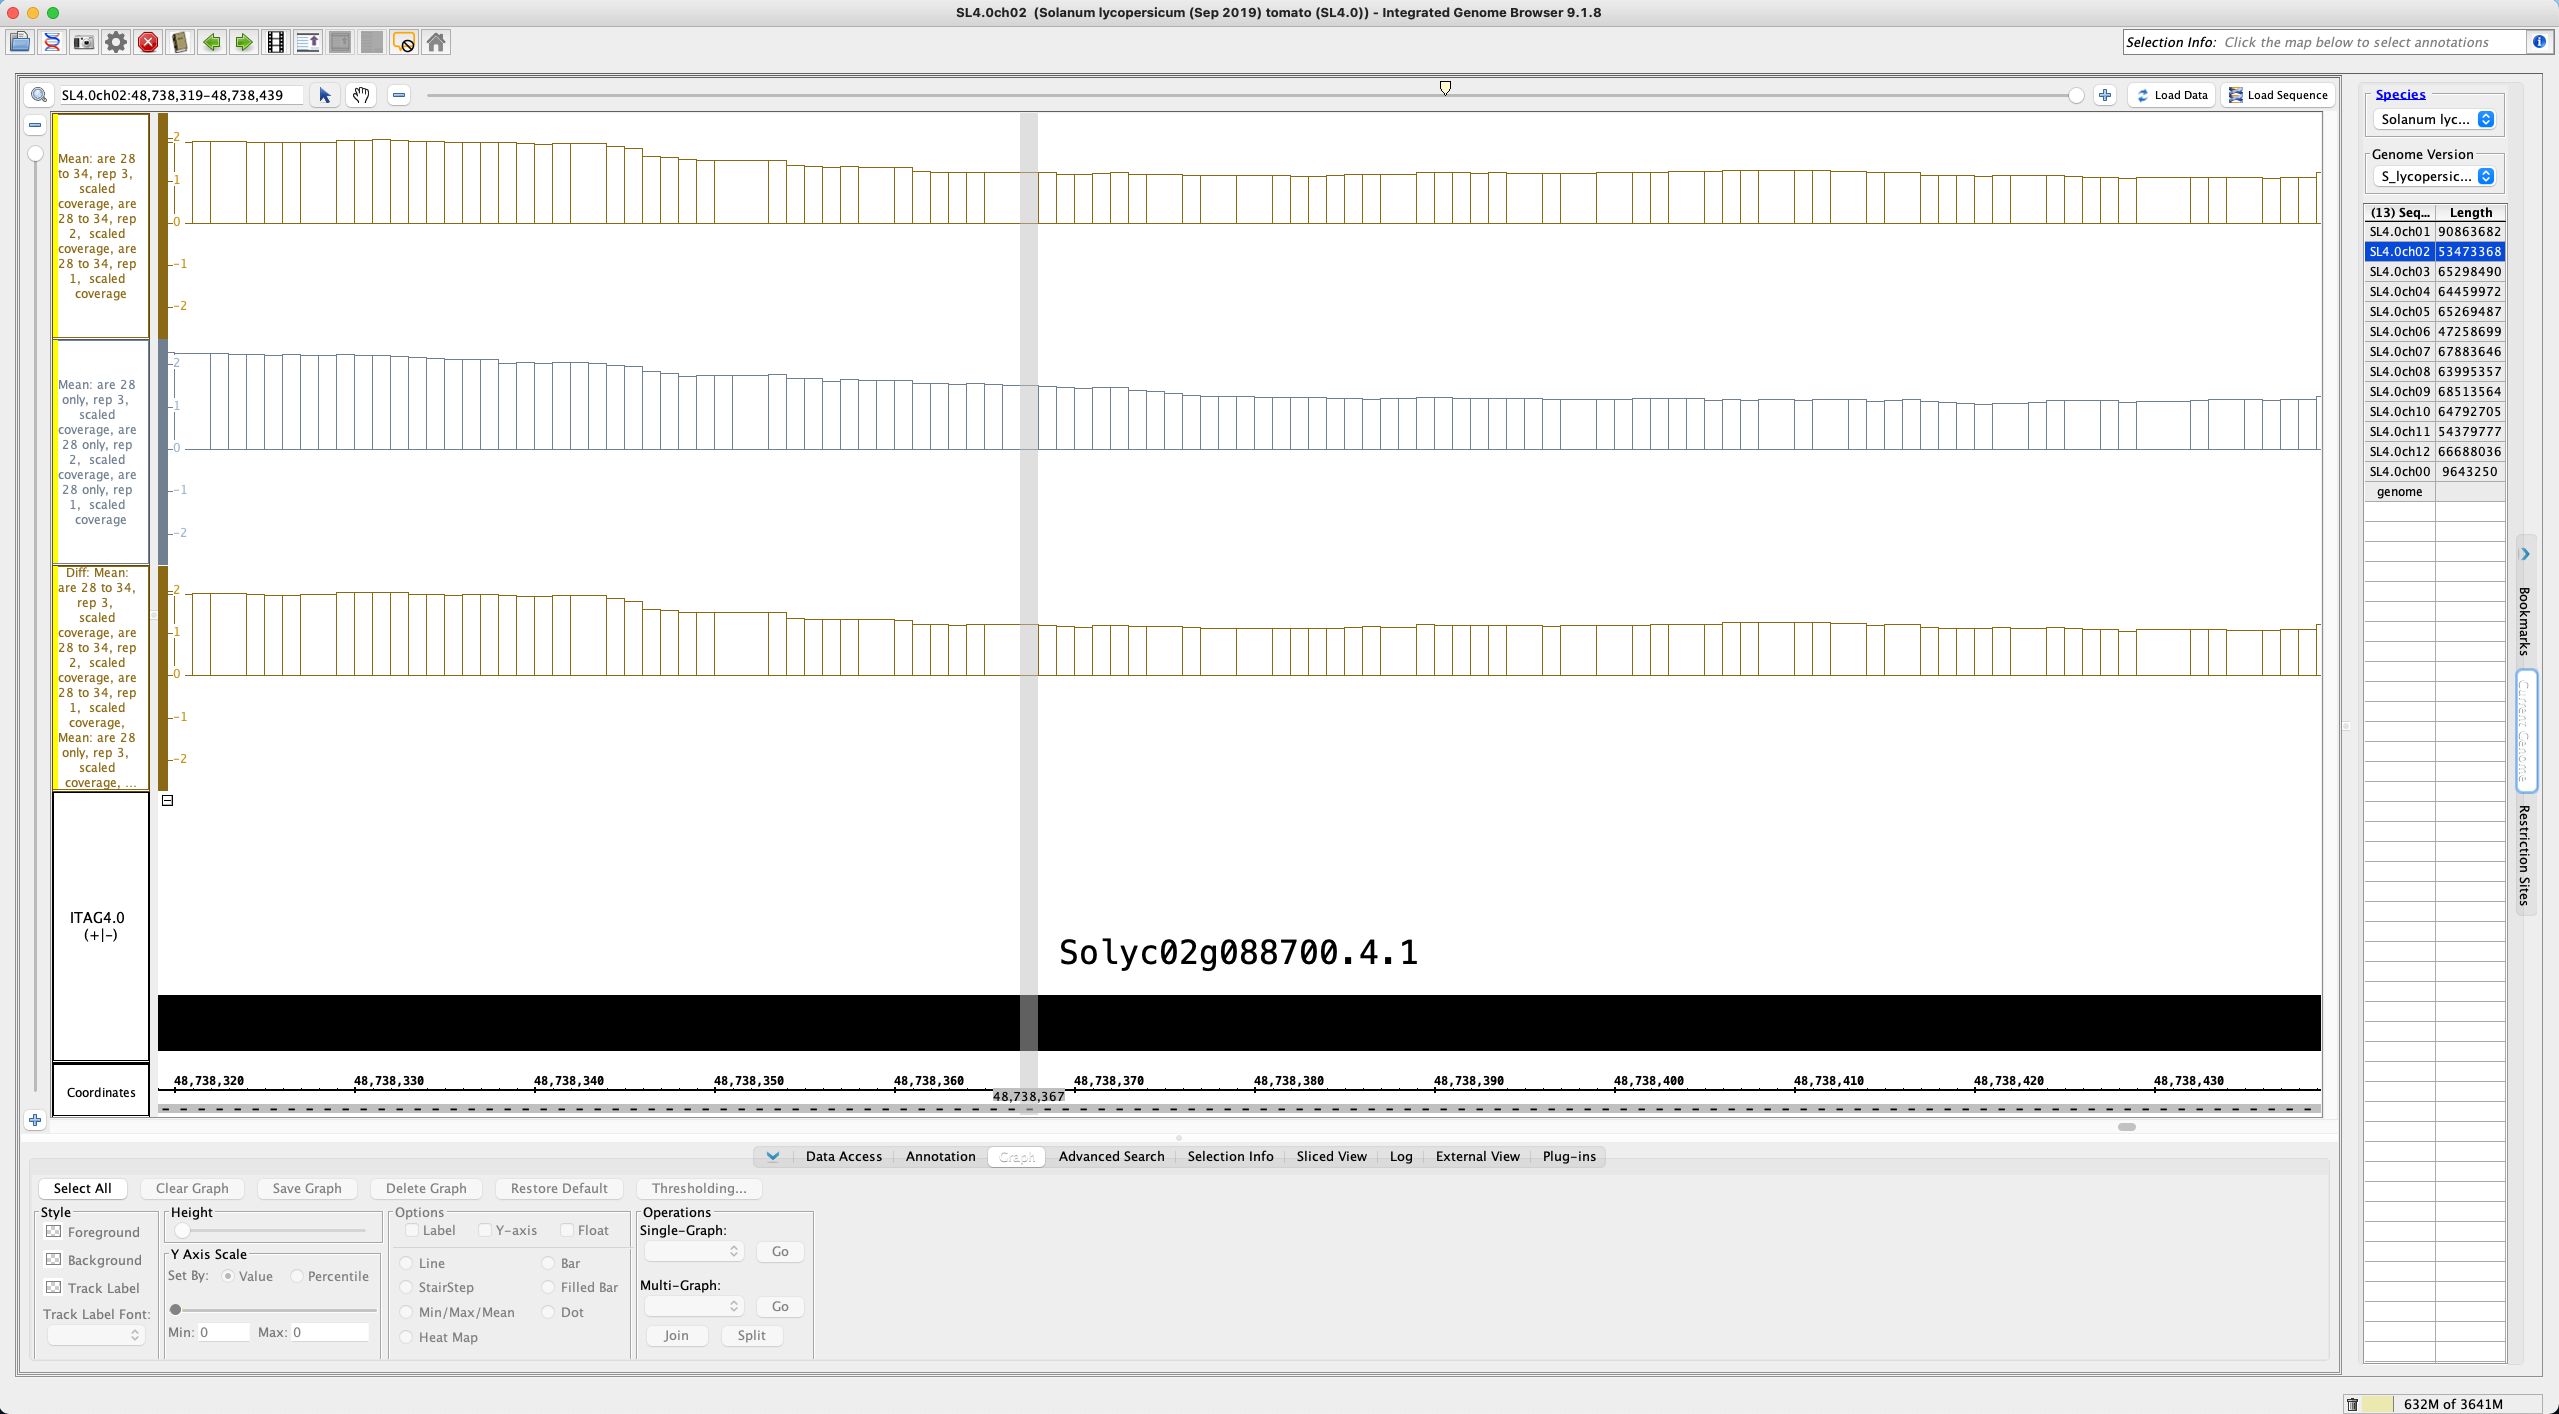
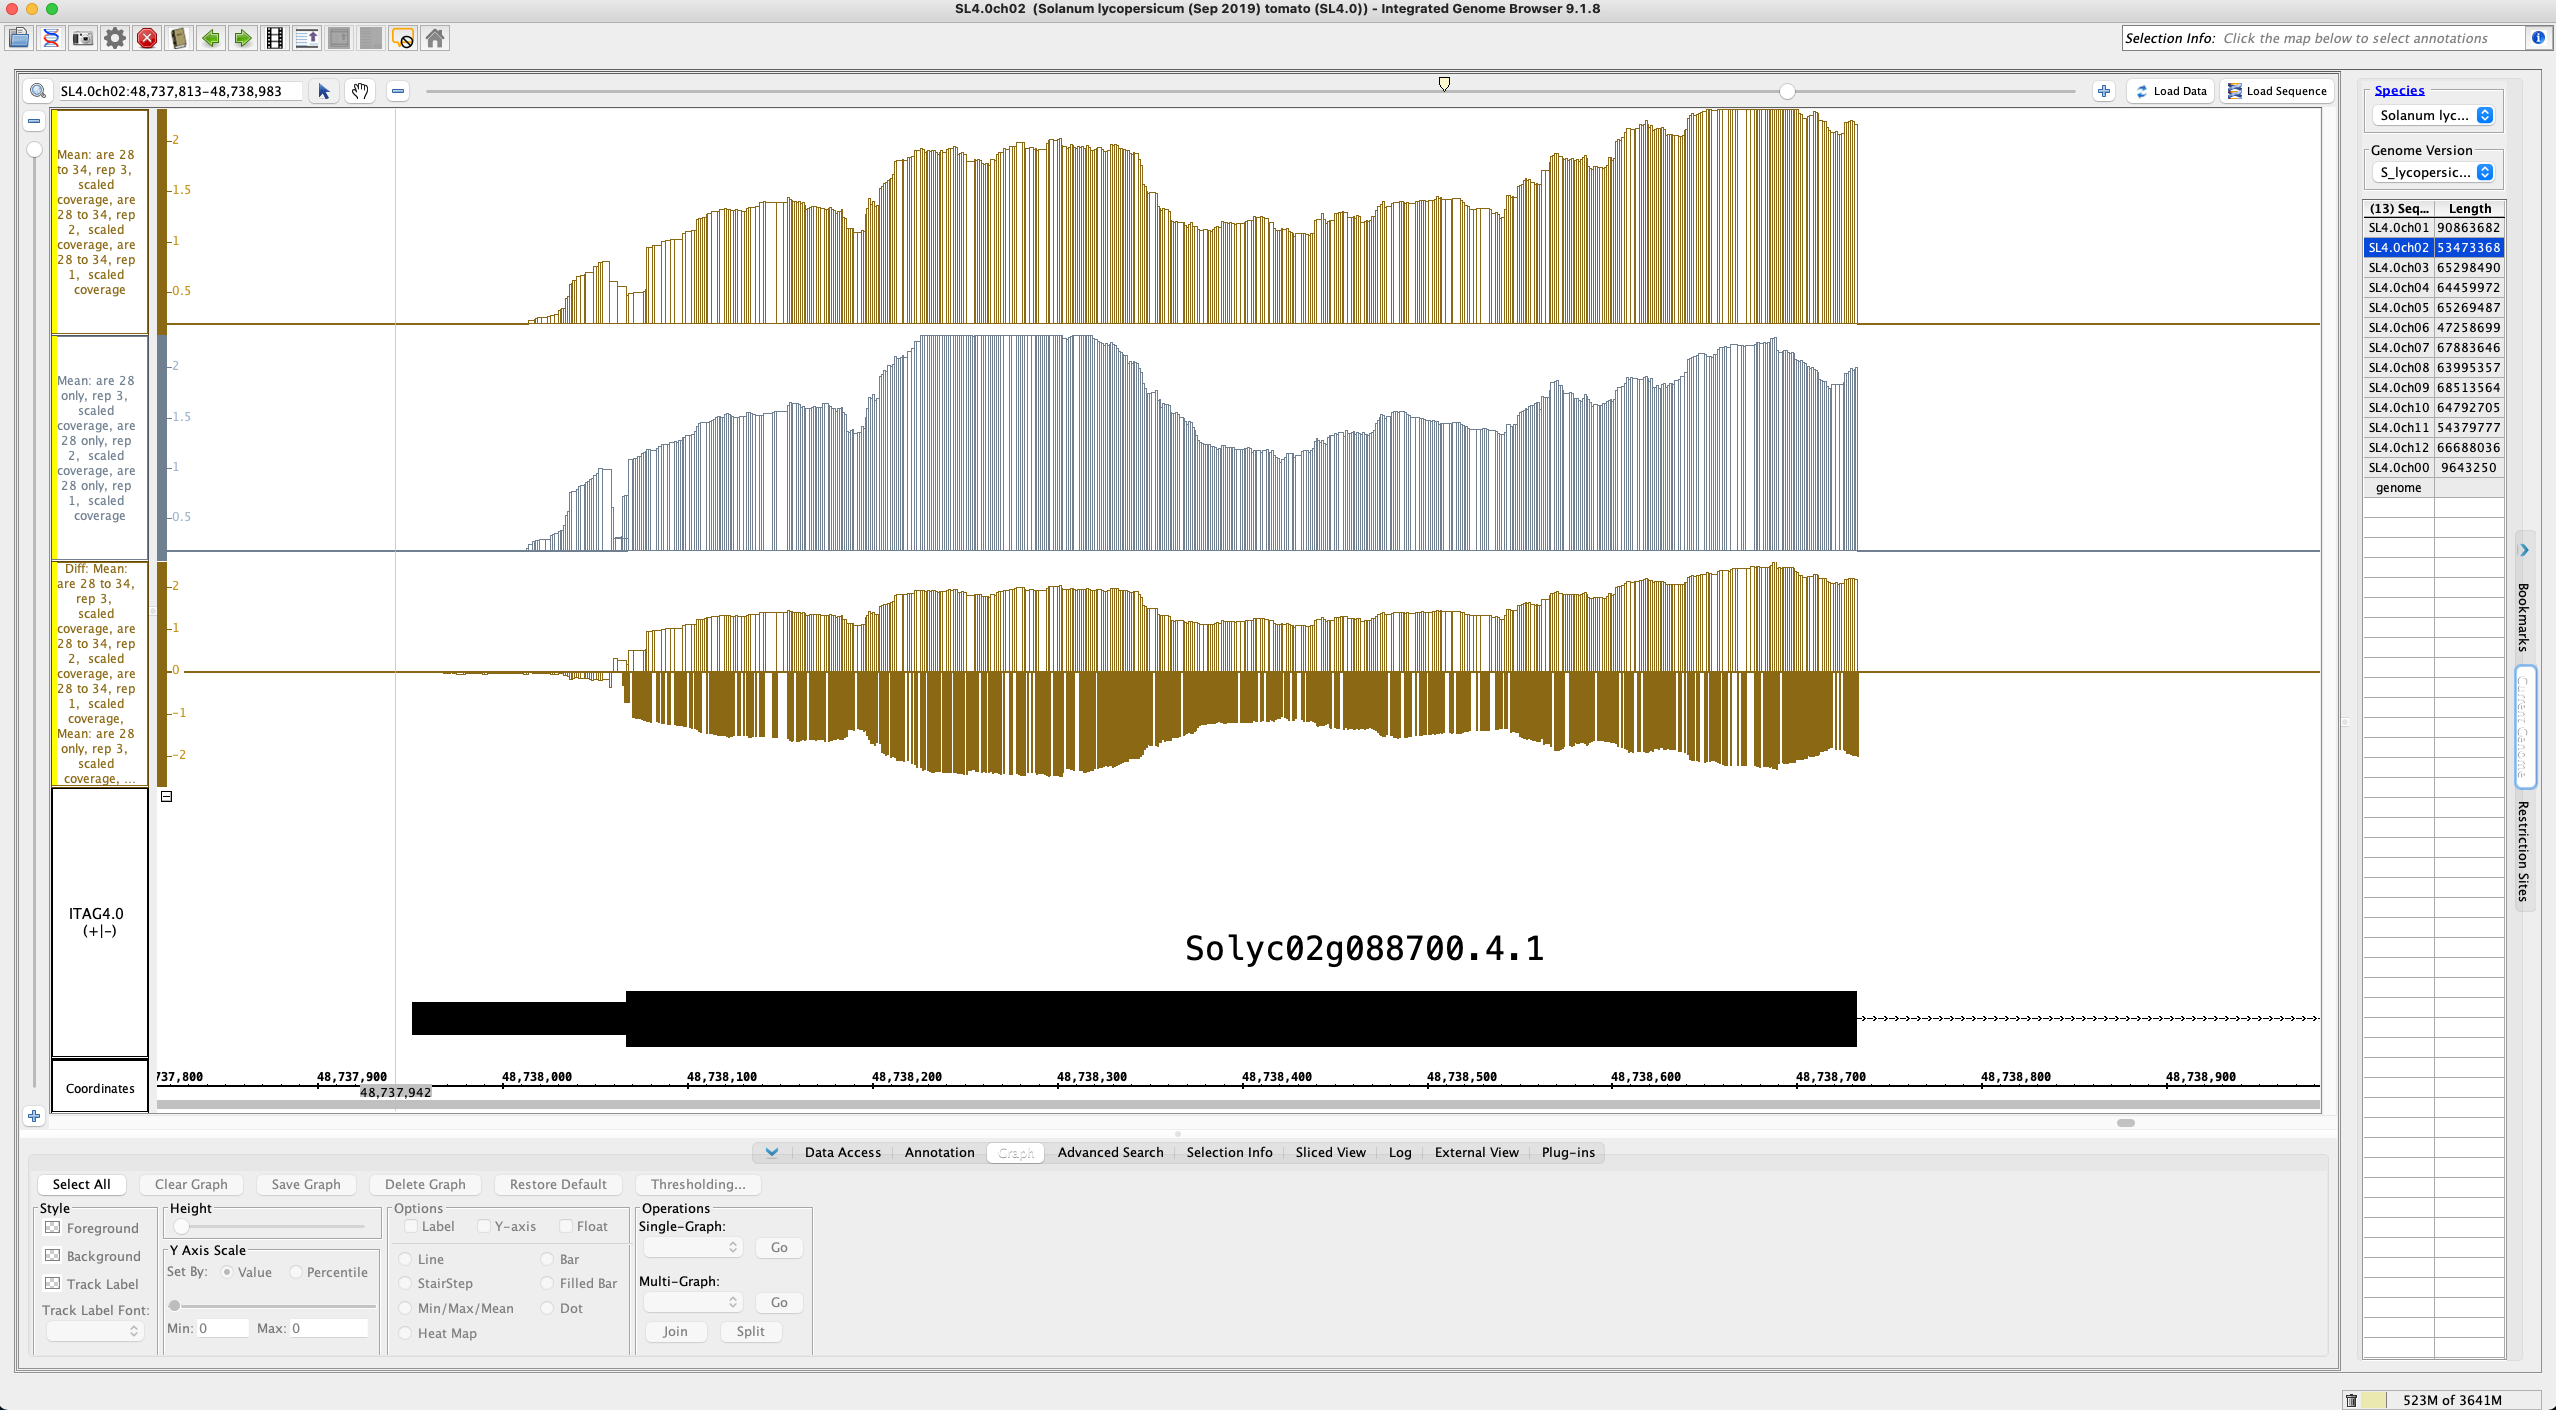
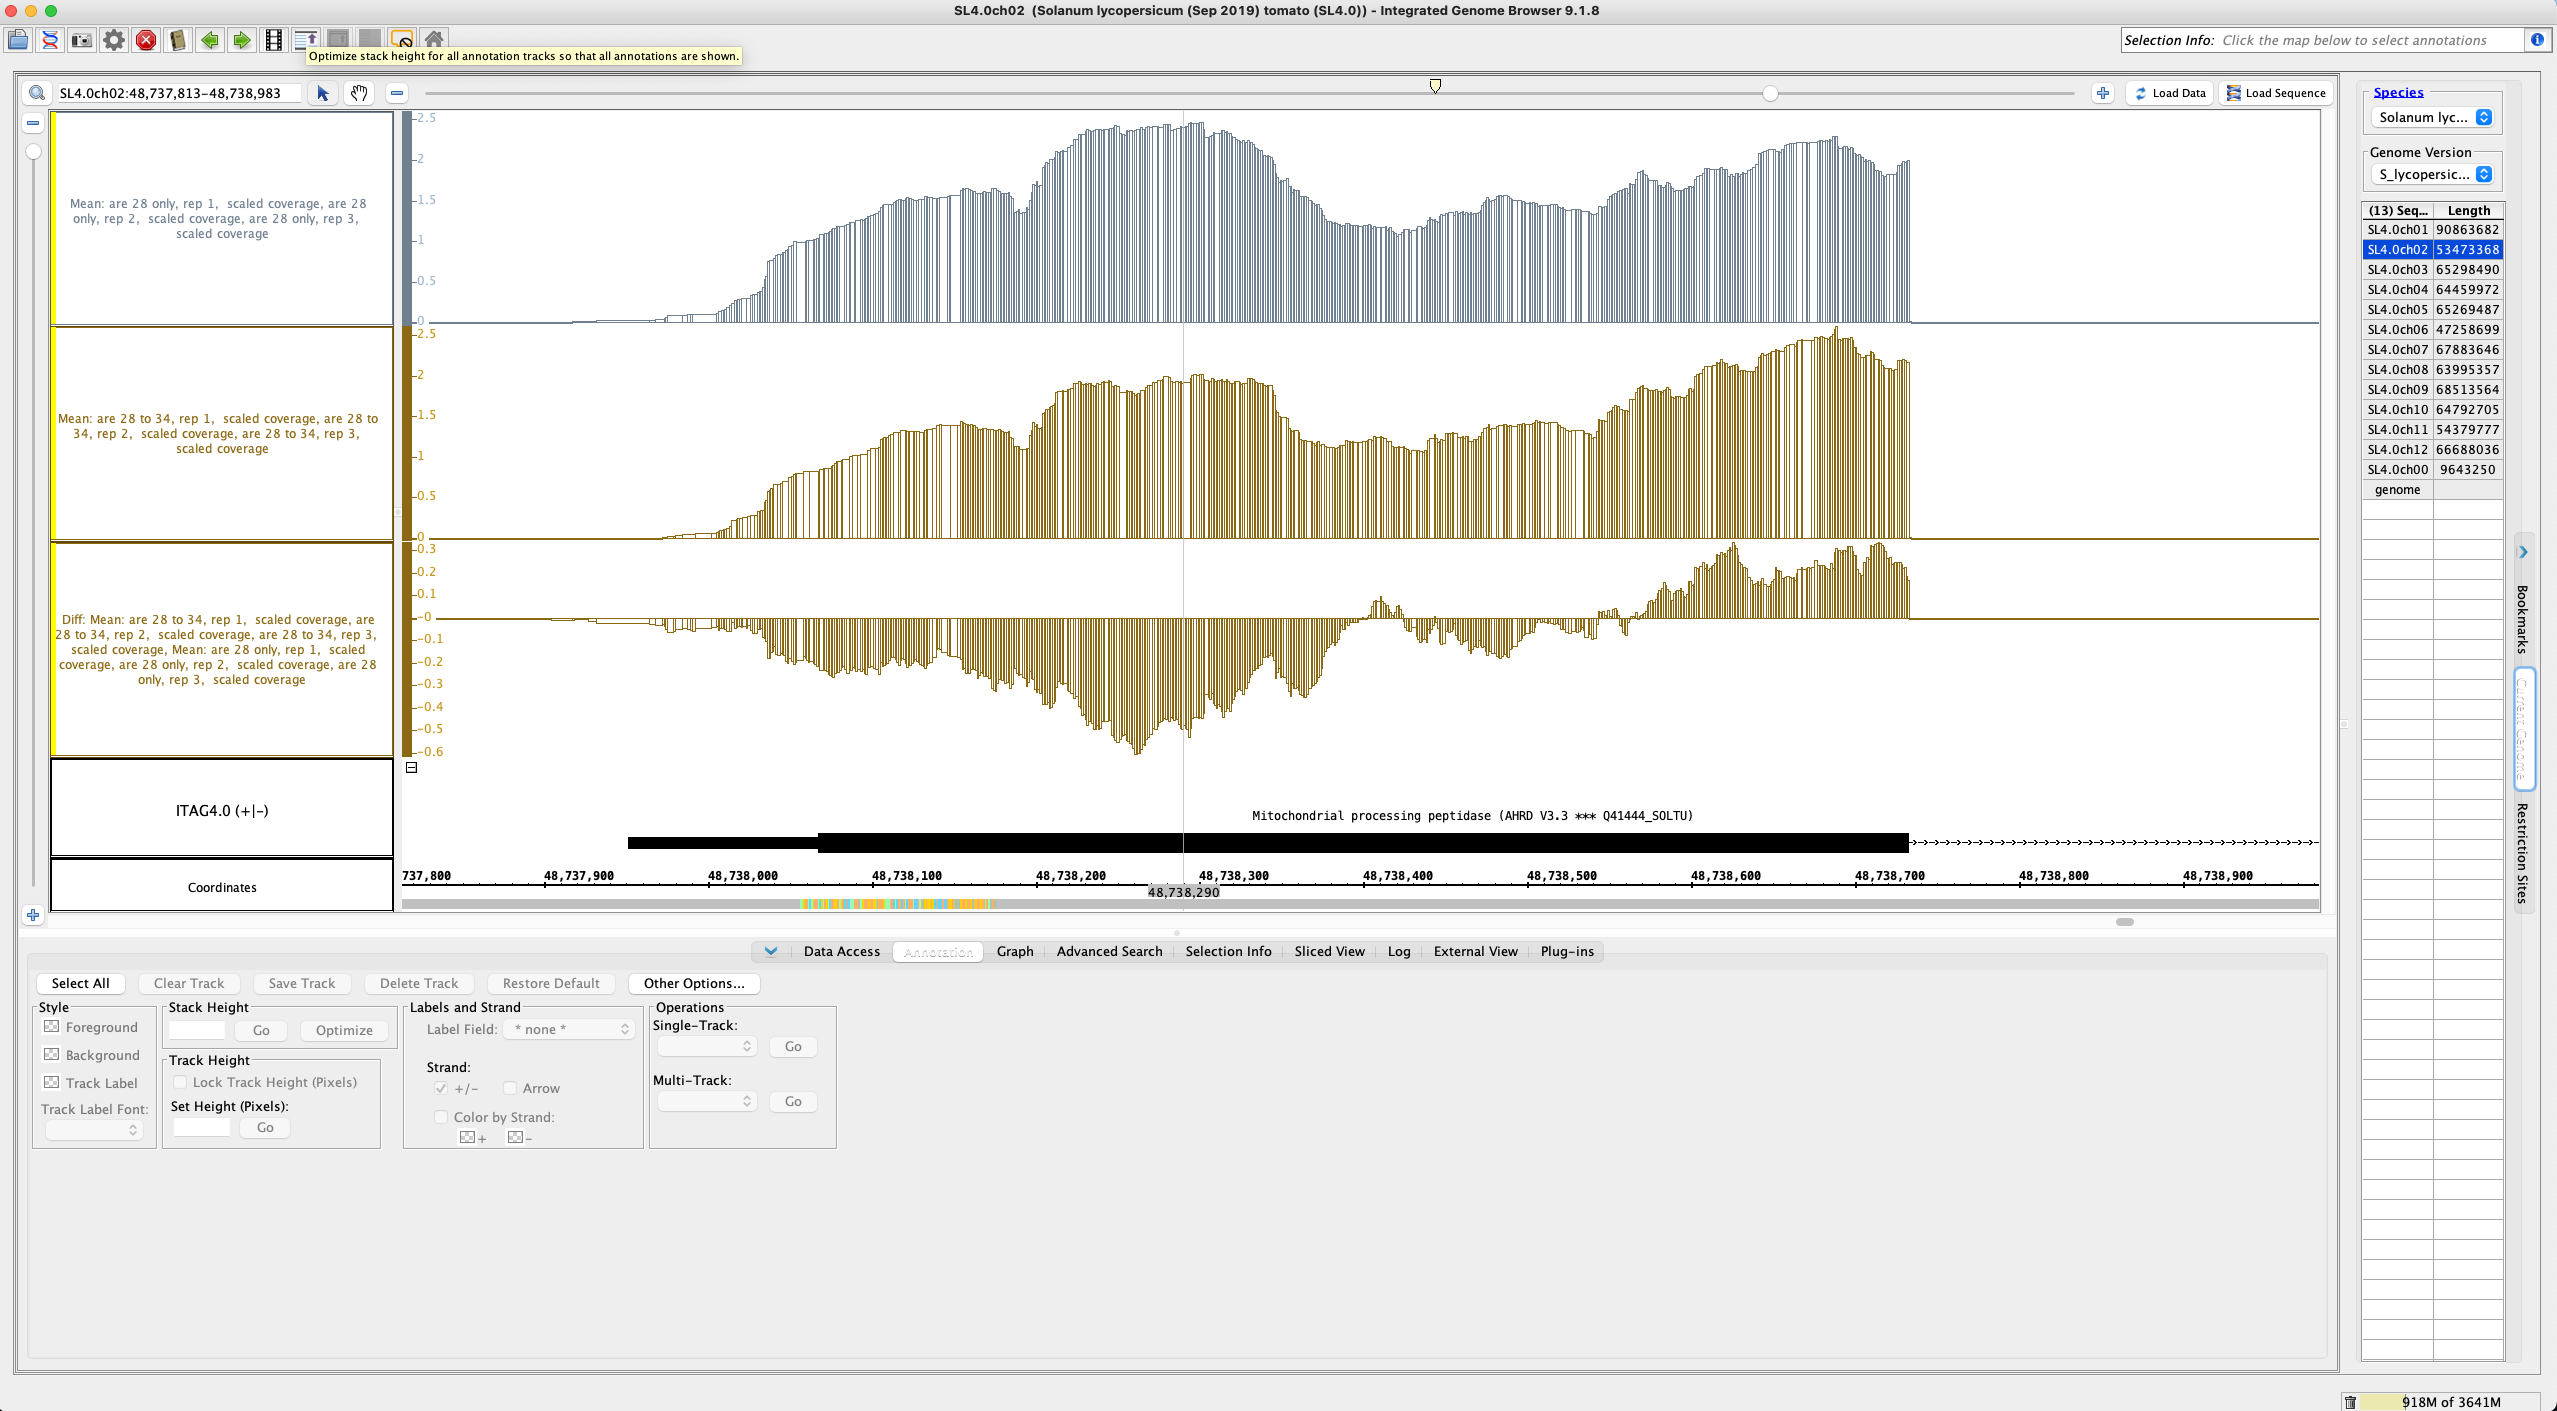
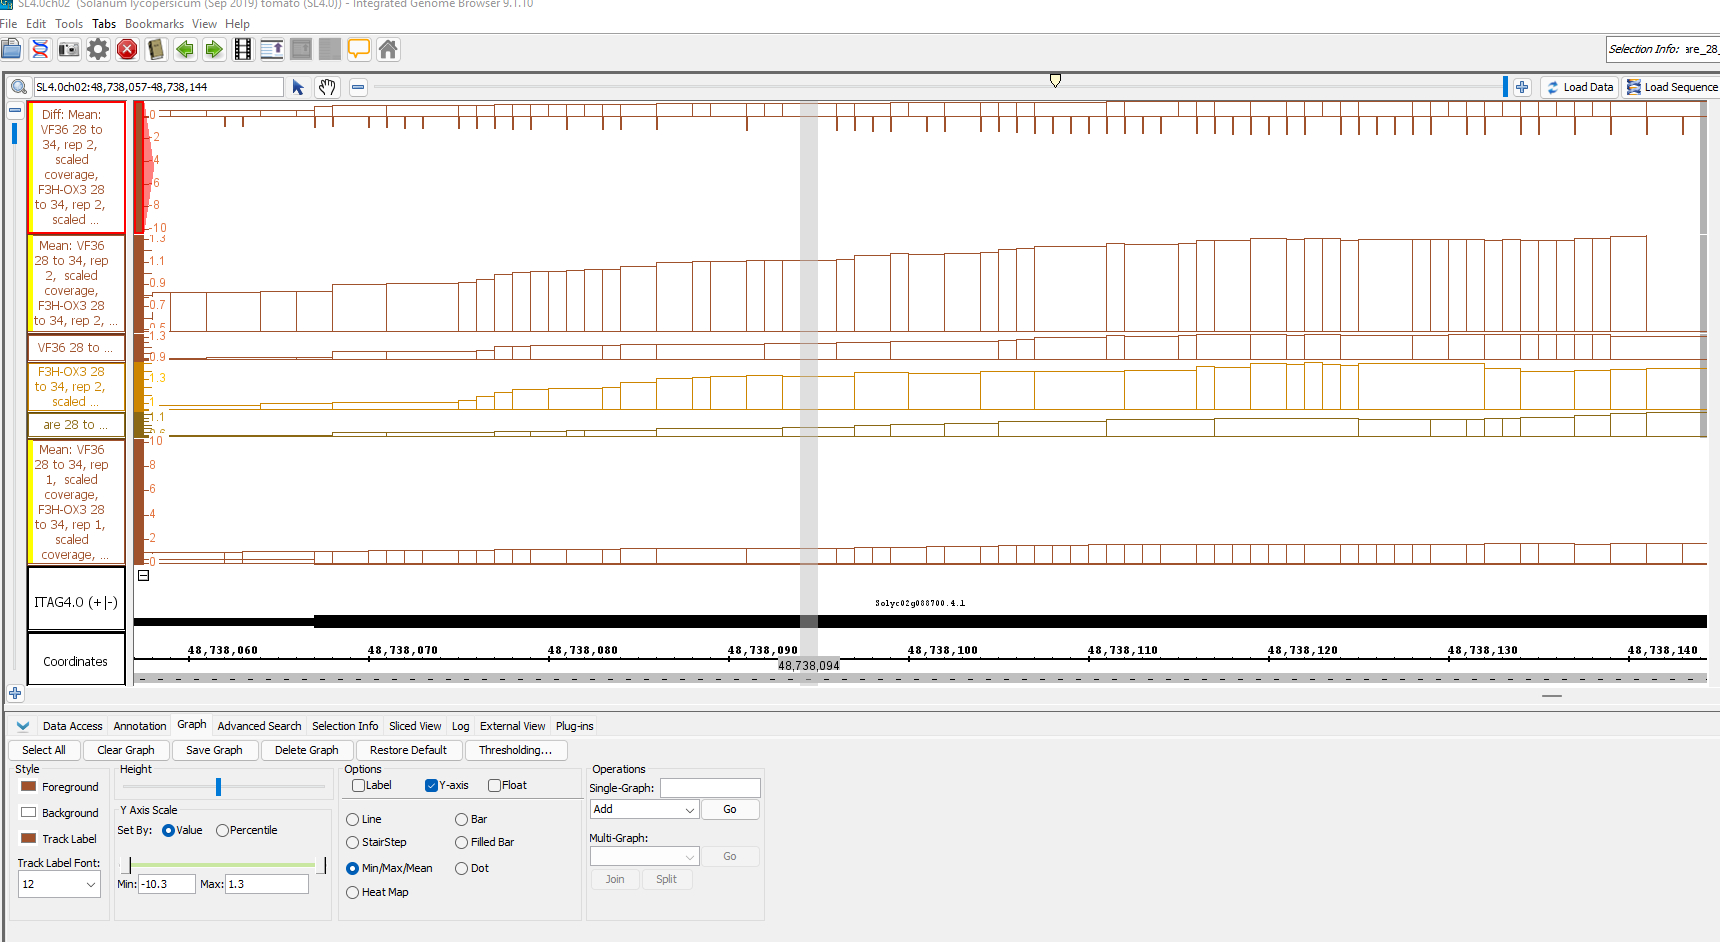
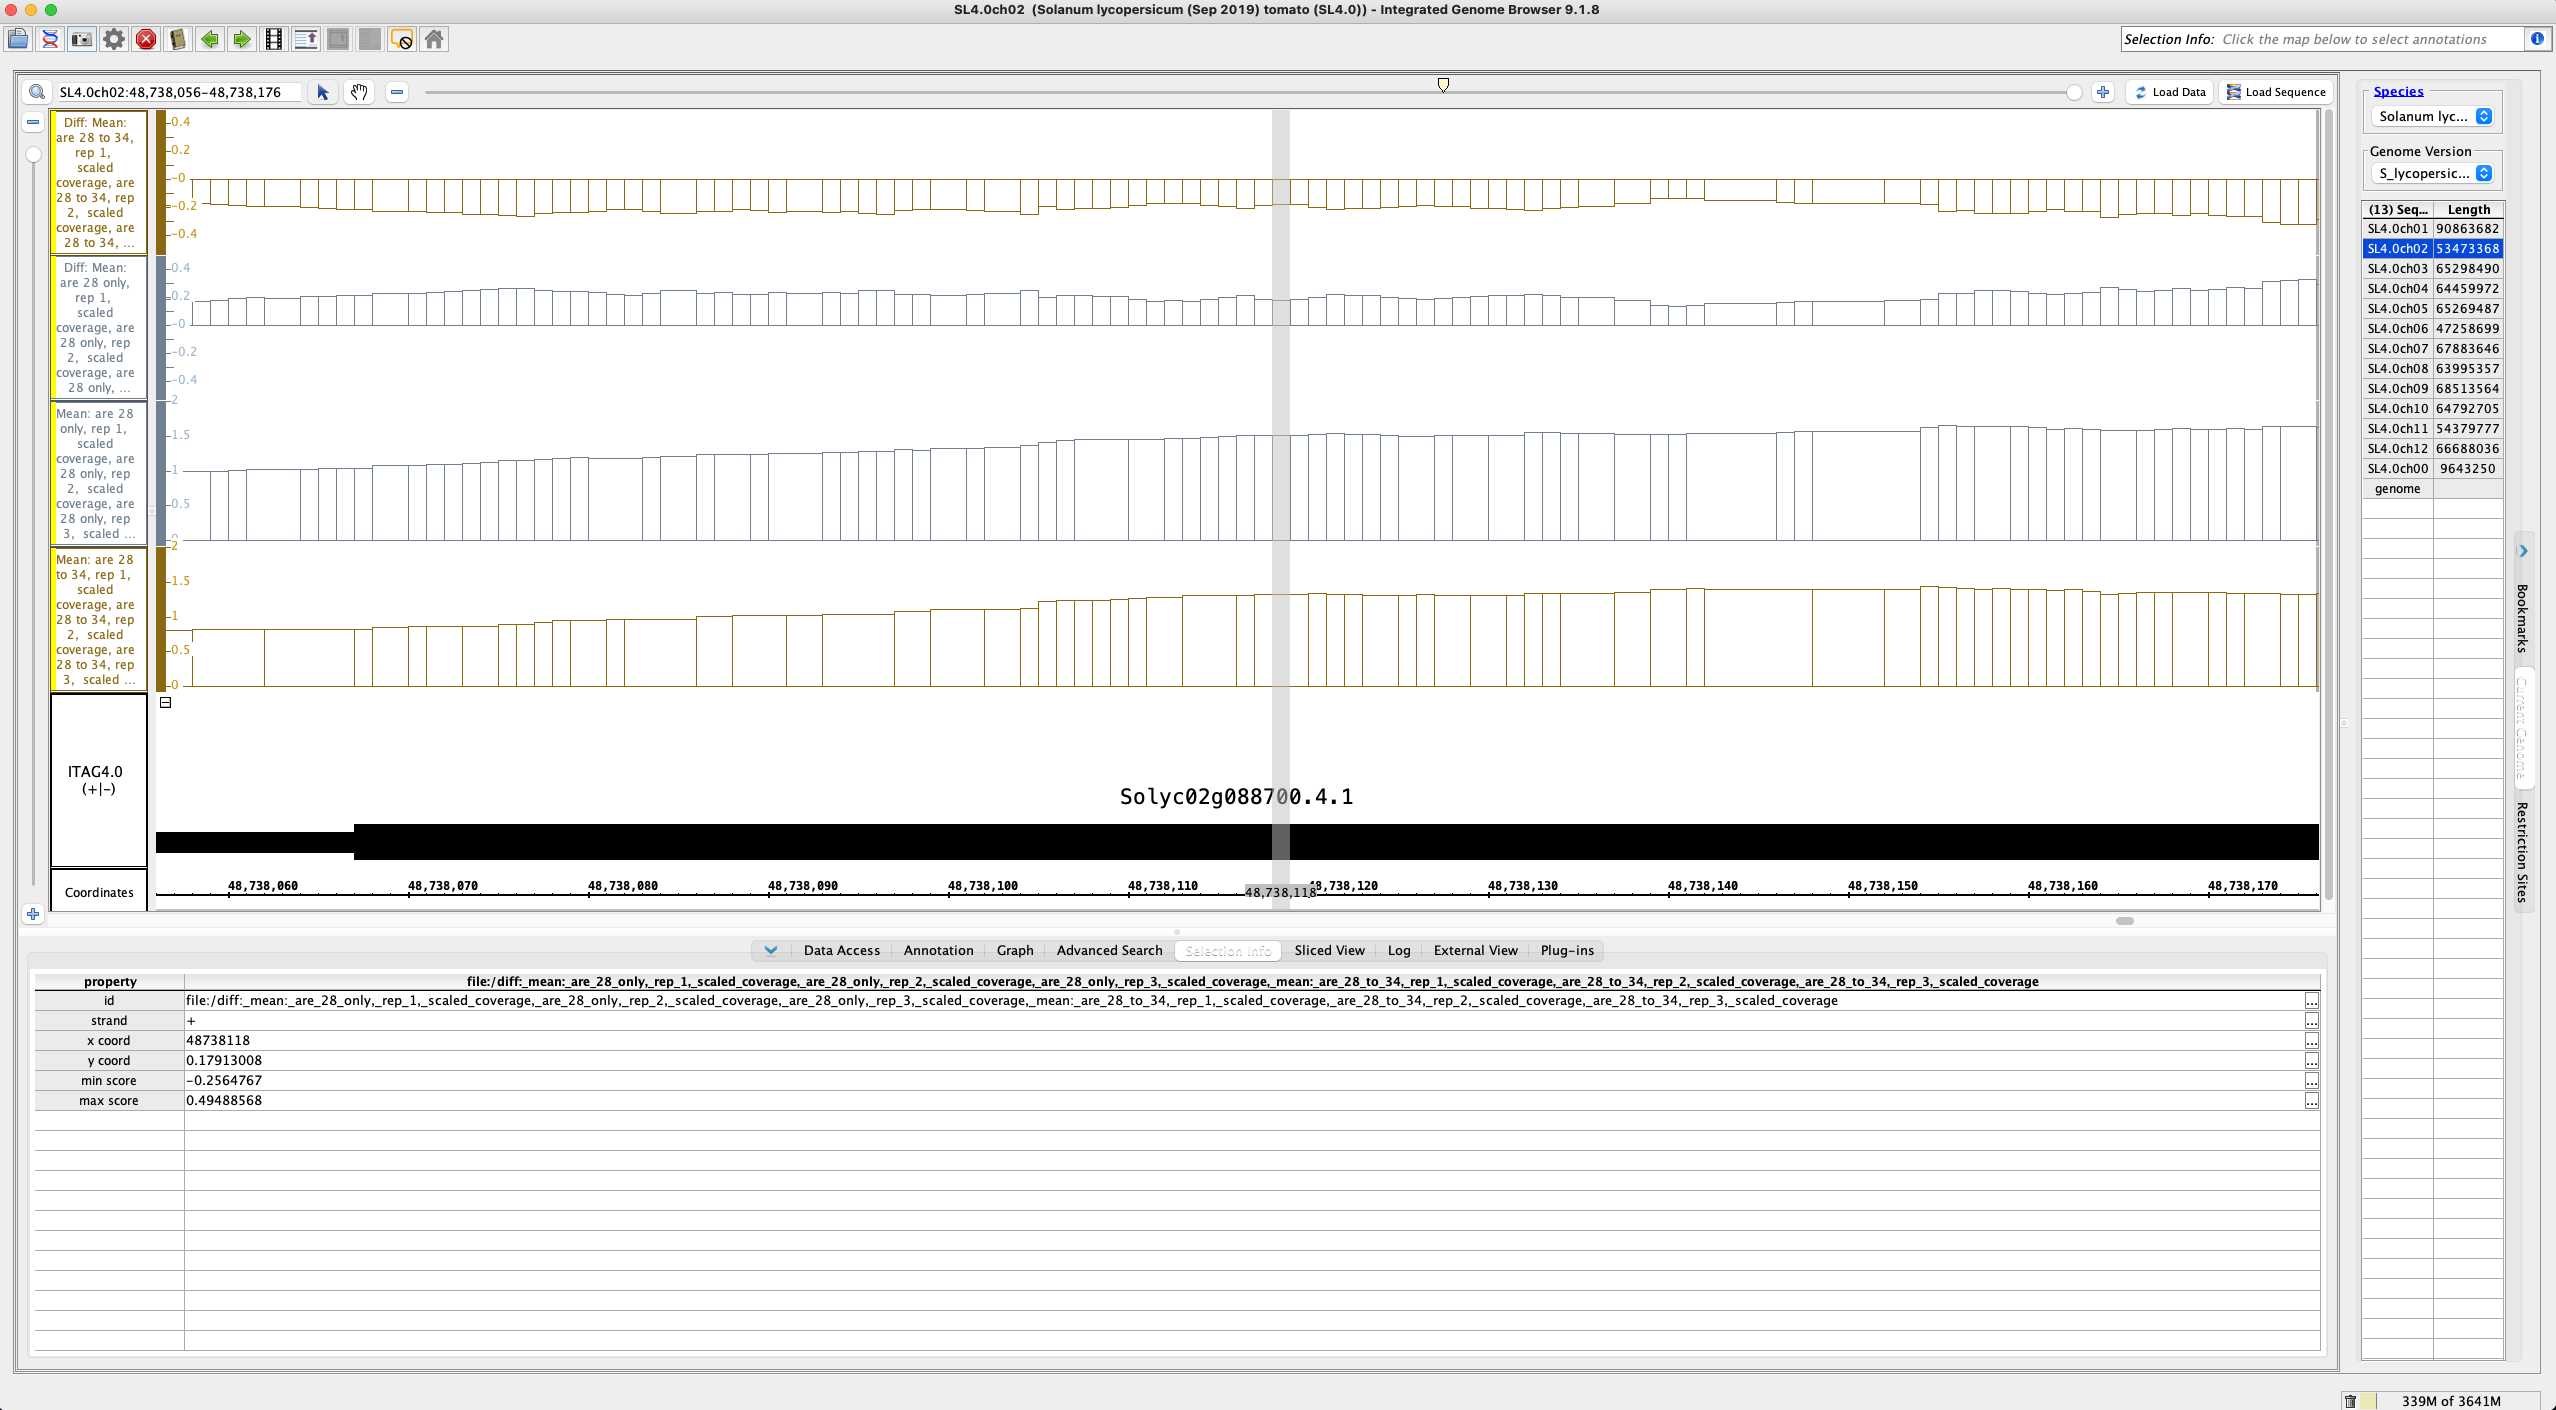
During a live demo, one of the attendees noticed a problem with a graph operation.
The sum of two graphs did not appear to be correct.
To repeat / investigate:
- Add data source from
IGBF-3064 - Load six scaled coverage graphs from the graphs folder
- Select 3 of the graphs by shift-clicking the left side graph track labels (red outline appears around the label when the graph track is selected)
- Select use the Graph Operations multi-graph menu "Mean" to create a new graph, which is supposed to be the average of the selected graphs
- Repeat the above with another 3 graphs
- Now, subtract the mean graphs from each other
- Check the y-axis values carefully to ensure that the subtraction was correctly done.
Report what you see, along with images showing incorrect or correct behavior.