Details
-
Type:
Task
-
Status: Closed (View Workflow)
-
Priority:
 Major
Major
-
Resolution: Done
-
Affects Version/s: None
-
Fix Version/s: None
-
Labels:None
-
Story Points:0.5
-
Epic Link:
-
Sprint:Spring 2 2022 Jan 18 - Jan 28, Spring 3 2022 Jan 31 - Feb 11, Spring 4 2022 Feb 14 - Feb 25
Description
During a live demo, one of the attendees noticed a problem with a graph operation.
The sum of two graphs did not appear to be correct.
To repeat / investigate:
- Add data source from
IGBF-3064 - Load six scaled coverage graphs from the graphs folder
- Select 3 of the graphs by shift-clicking the left side graph track labels (red outline appears around the label when the graph track is selected)
- Select use the Graph Operations multi-graph menu "Mean" to create a new graph, which is supposed to be the average of the selected graphs
- Repeat the above with another 3 graphs
- Now, subtract the mean graphs from each other
- Check the y-axis values carefully to ensure that the subtraction was correctly done.
Report what you see, along with images showing incorrect or correct behavior.
Attachments
Issue Links
Activity
| Field | Original Value | New Value |
|---|---|---|
| Epic Link | IGBF-1765 [ 17855 ] |
| Description |
During a live demo, one of the attendees noticed a problem with a graph operation.
The sum of two graphs did not appear to be correct. |
During a live demo, one of the attendees noticed a problem with a graph operation.
The sum of two graphs did not appear to be correct. To repeat / investigate: * Add data source from * Load six scaled coverage graphs from the graphs folder * Select 3 of the graphs by shift-clicking the left side graph track labels (red outline appears around the label when the graph track is selected) * Select use the Graph Operations multi-graph menu "Mean" to create a new graph, which is supposed to be the average of the selected graphs * Repeat the above with another 3 graphs * Now, subtract the mean graphs from each other * Check the y-axis values carefully to ensure that the subtraction was correctly done. Report what you see, along with images showing incorrect or correct behavior. |
| Assignee | Omkar Marne [ omarne ] |
| Status | To-Do [ 10305 ] | In Progress [ 3 ] |
| Attachment | Mean.png [ 17086 ] |
| Attachment | Subtract.png [ 17087 ] |
| Attachment | Subtract.png [ 17088 ] |
| Status | In Progress [ 3 ] | Needs 1st Level Review [ 10005 ] |
| Assignee | Omkar Marne [ omarne ] | Ann Loraine [ aloraine ] |
| Attachment | Addition.png [ 17089 ] |
| Sprint | Spring 2 2022 Jan 18 - Jan 28 [ 137 ] | Spring 2 2022 Jan 18 - Jan 28, Spring 3 2022 Jan 31 - Feb 11 [ 137, 138 ] |
| Rank | Ranked higher |
| Status | Needs 1st Level Review [ 10005 ] | First Level Review in Progress [ 10301 ] |
| Status | First Level Review in Progress [ 10301 ] | To-Do [ 10305 ] |
| Assignee | Ann Loraine [ aloraine ] |
| Assignee | Omkar Marne [ omarne ] |
| Assignee | Omkar Marne [ omarne ] |
| Assignee | Omkar Marne [ omarne ] |
| Status | To-Do [ 10305 ] | In Progress [ 3 ] |
| Sprint | Spring 2 2022 Jan 18 - Jan 28, Spring 3 2022 Jan 31 - Feb 11 [ 137, 138 ] | Spring 2 2022 Jan 18 - Jan 28, Spring 3 2022 Jan 31 - Feb 11, Spring 4 2022 Feb 14 - Feb 25 [ 137, 138, 139 ] |
| Rank | Ranked higher |
| Attachment | Addition.png [ 17089 ] |
| Attachment | Mean.png [ 17086 ] |
| Attachment | Subtract.png [ 17088 ] |
| Attachment | Subtract.png [ 17087 ] |
| Attachment | y-axis - 1st graph 4085.7.png [ 17176 ] |
| Attachment | y-axis 2nd graph 3389.1.png [ 17177 ] |
| Attachment | y-axis 3rd graph 3707.9.png [ 17178 ] |
| Attachment | Mean 1st,2nd,3rd 3726.7.png [ 17179 ] |
| Attachment | 4th graph 3499.4.png [ 17180 ] |
| Attachment | 5th graph 4167.3.png [ 17181 ] |
| Attachment | 6th graph 4369.3.png [ 17182 ] |
| Attachment | Mean 4th,5th,6th - 4012.png [ 17183 ] |
| Attachment | Mean difference.png [ 17184 ] |
| Comment | [ Mean result, addition result and subtraction result is correct for the selected graphs. Please see attached images. ] |
Hello [~aloraine], Please see attached images. I am getting the correct output for mean but I am not sure if the subtraction result of the 2 means graph is correct or incorrect.
| Attachment | Subtraction.png [ 17185 ] |
The images are too zoomed-out to be useful. You need to zoom in to the individual base pair level and hover the mouse over the bars to see what the actual values are by looking at the tooltip that appears.
Please see the example image I mentioned in my previous comment. Make images like that one, not the zoomed-out images showing the entire chromosome.
It might be helpful to go to this particular region that matches the image from the other ticket: SL4.0ch02:48,738,057-48,738,132, the region near gene Solyc02g088700.4, encoding "Mitochondrial processing peptidase (AHRD V3.3 *** Q41444_SOLTU)"
| Attachment | 4th graph 3499.4.png [ 17180 ] |
| Attachment | 5th graph 4167.3.png [ 17181 ] |
| Attachment | 6th graph 4369.3.png [ 17182 ] |
| Attachment | Mean 1st,2nd,3rd 3726.7.png [ 17179 ] |
| Attachment | Mean 4th,5th,6th - 4012.png [ 17183 ] |
| Attachment | Mean difference.png [ 17184 ] |
| Attachment | Subtraction.png [ 17185 ] |
| Attachment | y-axis - 1st graph 4085.7.png [ 17176 ] |
| Attachment | y-axis 2nd graph 3389.1.png [ 17177 ] |
| Attachment | y-axis 3rd graph 3707.9.png [ 17178 ] |
| Attachment | Mean 1.png [ 17186 ] |
| Attachment | Mean 1.png [ 17186 ] |
| Attachment | Mean 1.png [ 17187 ] |
| Attachment | Mean 2.png [ 17188 ] |
| Attachment | Difference.png [ 17189 ] |
| Status | In Progress [ 3 ] | Needs 1st Level Review [ 10005 ] |
| Assignee | Omkar Marne [ omarne ] | Ann Loraine [ aloraine ] |
Hello, Dr. [~aloraine] Please review the latest snapshots and suggest the changes if required.
I am getting the correct output for mean but I am not sure if the subtraction result of the 2 means graph is correct or incorrect.
| Assignee | Ann Loraine [ aloraine ] |
| Assignee | Nowlan Freese [ nfreese ] |
| Status | Needs 1st Level Review [ 10005 ] | First Level Review in Progress [ 10301 ] |
Testing:
Added http://lorainelab-quickload.scidas.org/hotpollen/ as a new data source.
Opened the S_lycopersicum_Sep_2019 genome
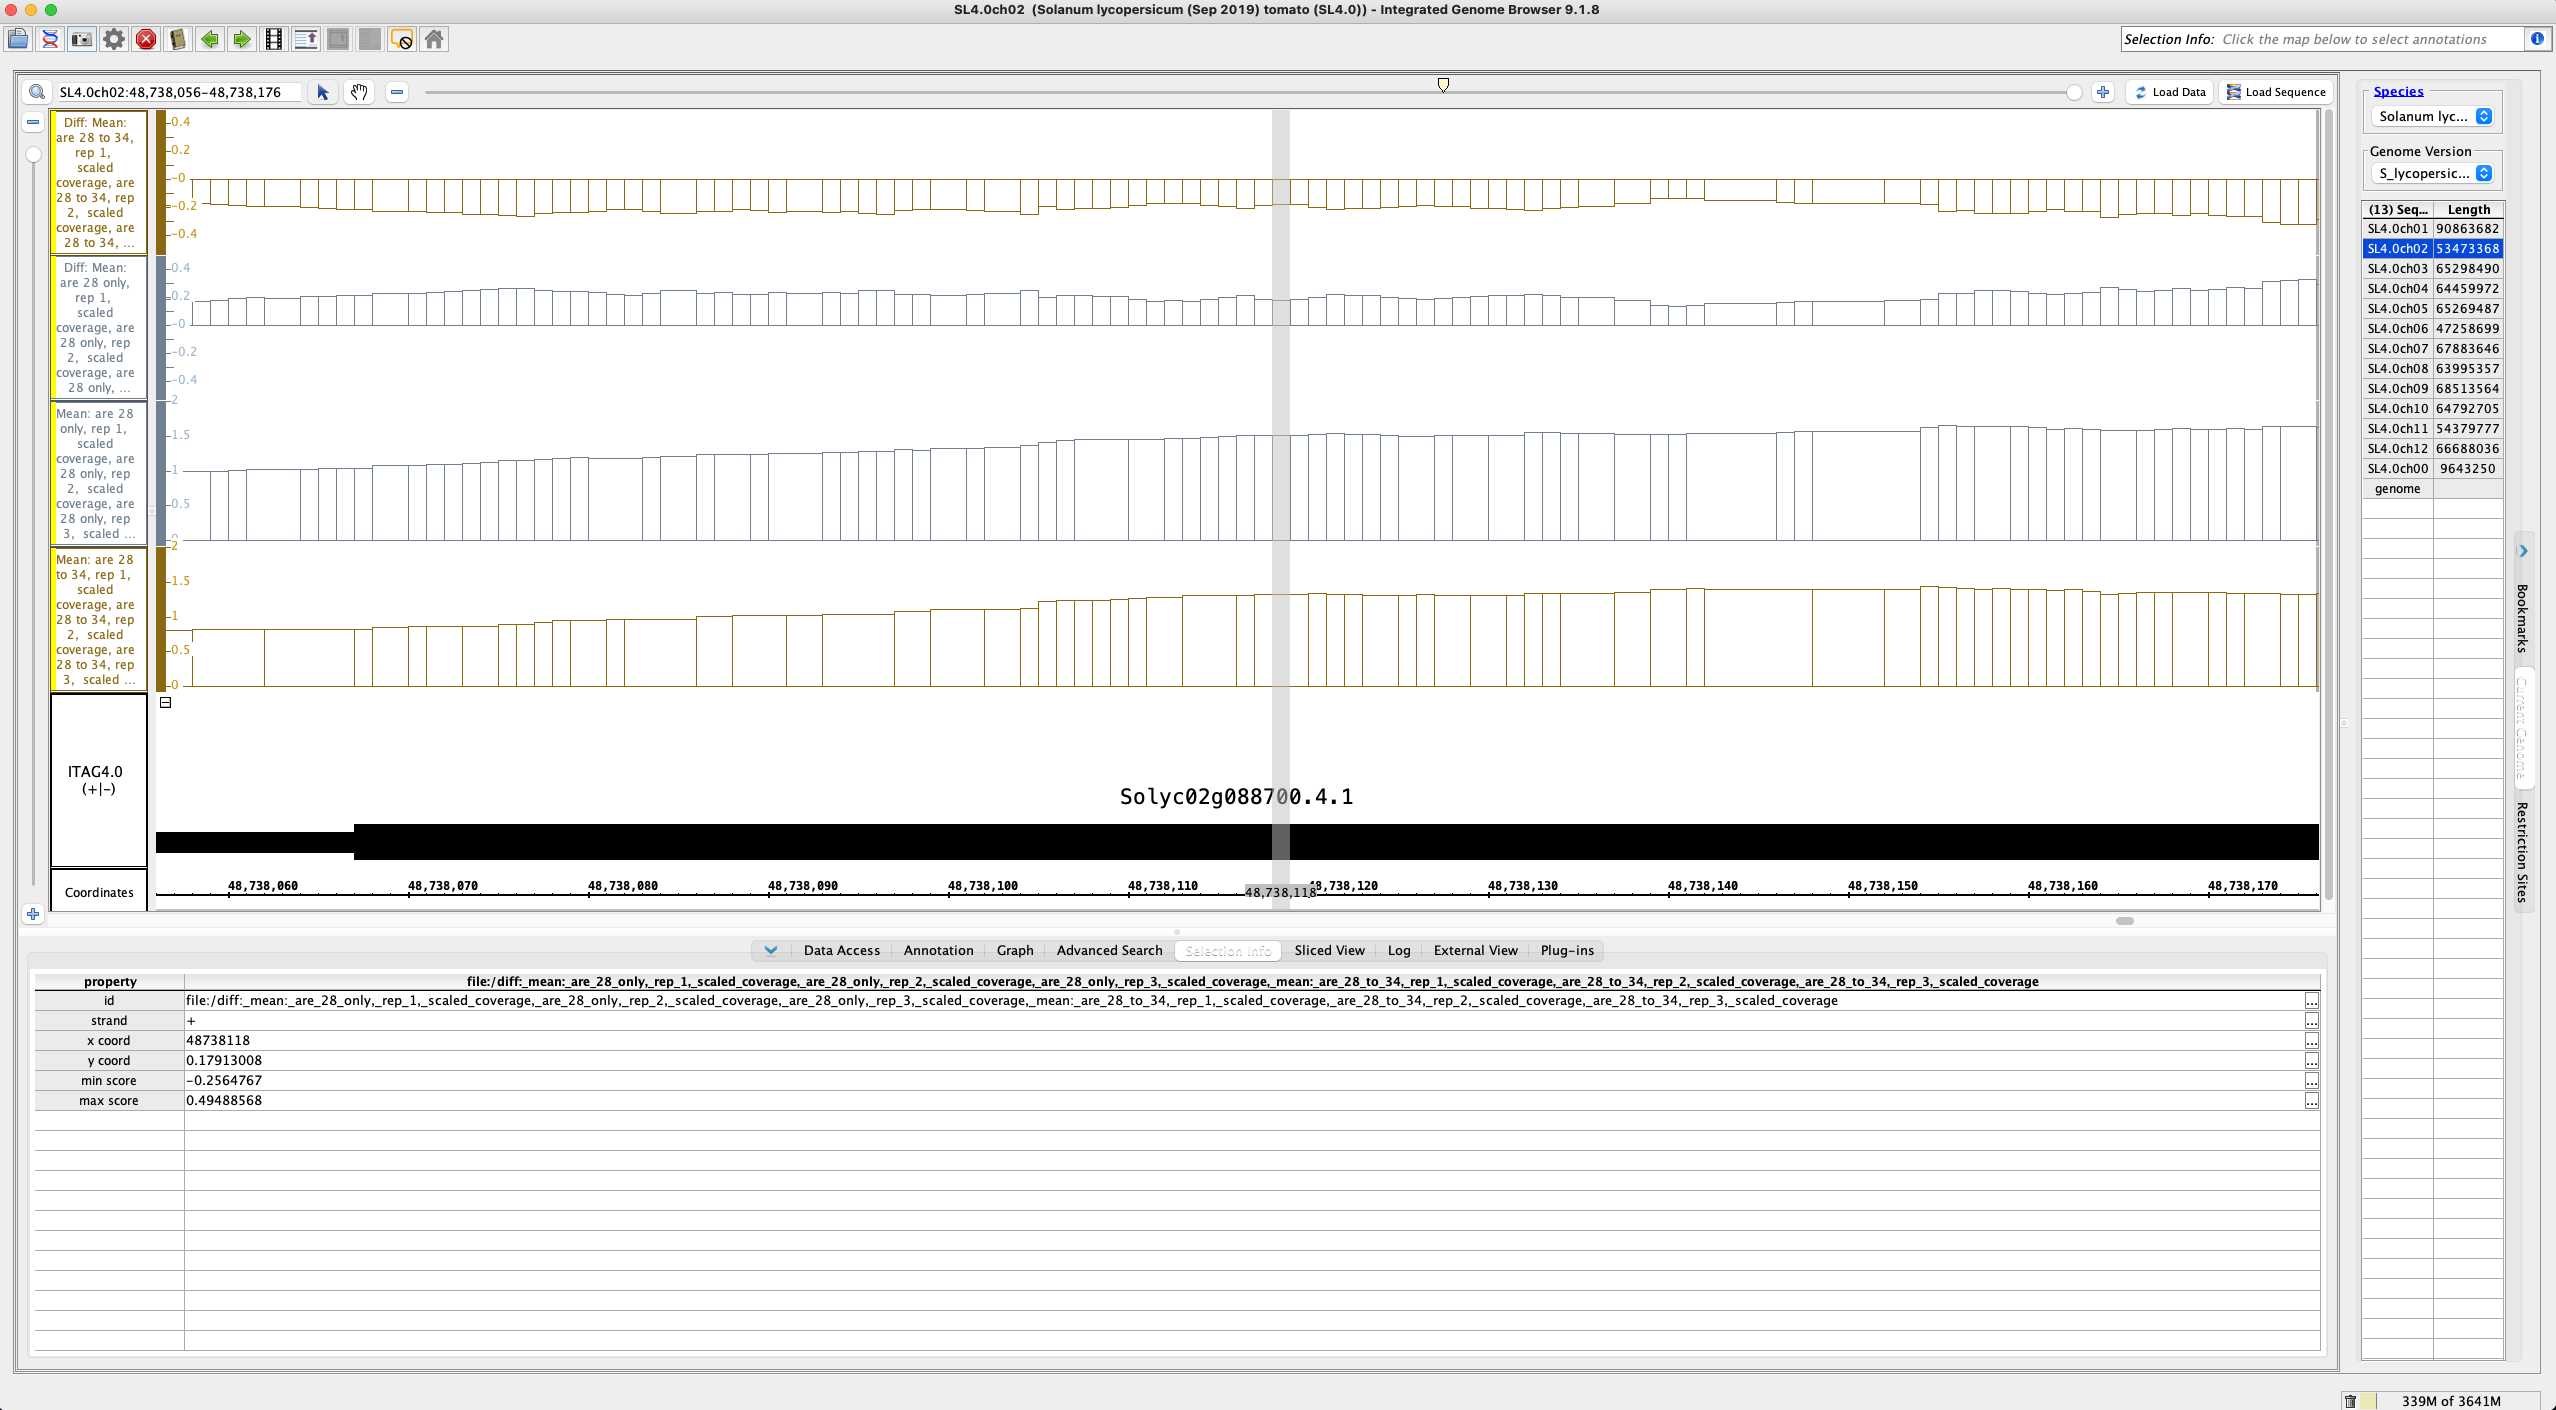
Navigated to SL4.0ch02:48,738,056-48,738,176
Add the following scaled coverage graphs:
are 28 only, rep 1, scaled coverage
are 28 only, rep 2, scaled coverage
are 28 only, rep 3, scaled coverage
are 28 to 34, rep 1, scaled coverage
are 28 to 34, rep 2, scaled coverage
are 28 to 34, rep 3, scaled coverage
I selected the x coordinate 48738118
Reported values at that coordinate:
1.59346
1.07506
1.31444
Calculator reports mean as: 1.3276533
IGB reports mean as: 1.3276533
1.41024
1.72839
1.38172
Calculator reports mean as: 1.5067833
IGB reports mean as: 1.5067834
Subtracting each mean from the other:
Calculator reports value as: -0.17913
Calculator reports value as: 0.17913
IGB reports value as: 0.17913008
IGB reports value as: -0.17913008
I see no difference between the expected values and what IGB reports. The means had repeating values at the end, so I would potentially expect some very small differences, but I don't see anything that would suggest that IGB is calculating the means or subtracting the values incorrectly.
I also added the two mean graphs together and the values reported by IGB matched the expected values.
I attached the image 48738118.png showing the two means and the two diffs.
Tested on Mac 11.6.3 on IGB 9.1.8 release.
| Attachment | 48738118.png [ 17190 ] |
| Assignee | Nowlan Freese [ nfreese ] |
| Status | First Level Review in Progress [ 10301 ] | Needs 1st Level Review [ 10005 ] |
| Status | Needs 1st Level Review [ 10005 ] | First Level Review in Progress [ 10301 ] |
| Status | First Level Review in Progress [ 10301 ] | Needs 1st Level Review [ 10005 ] |
| Status | Needs 1st Level Review [ 10005 ] | First Level Review in Progress [ 10301 ] |
| Assignee | Nowlan Freese [ nfreese ] |
Additional testing:
Add http://lorainelab-quickload.scidas.org/hotpollen/ as a new data source.
Open the S_lycopersicum_Sep_2019 genome
Navigate to SL4.0ch02:48,738,056-48,738,176
Add the following scaled coverage graphs:
are 28 only, rep 1, scaled coverage
are 28 only, rep 2, scaled coverage
are 28 only, rep 3, scaled coverage
are 28 to 34, rep 1, scaled coverage
are 28 to 34, rep 2, scaled coverage
are 28 to 34, rep 3, scaled coverage
Click Load Data
Create Mean graphs for the two groups of 3
Hide the original 6 scaled coverage graphs
Create Diff graph from the means
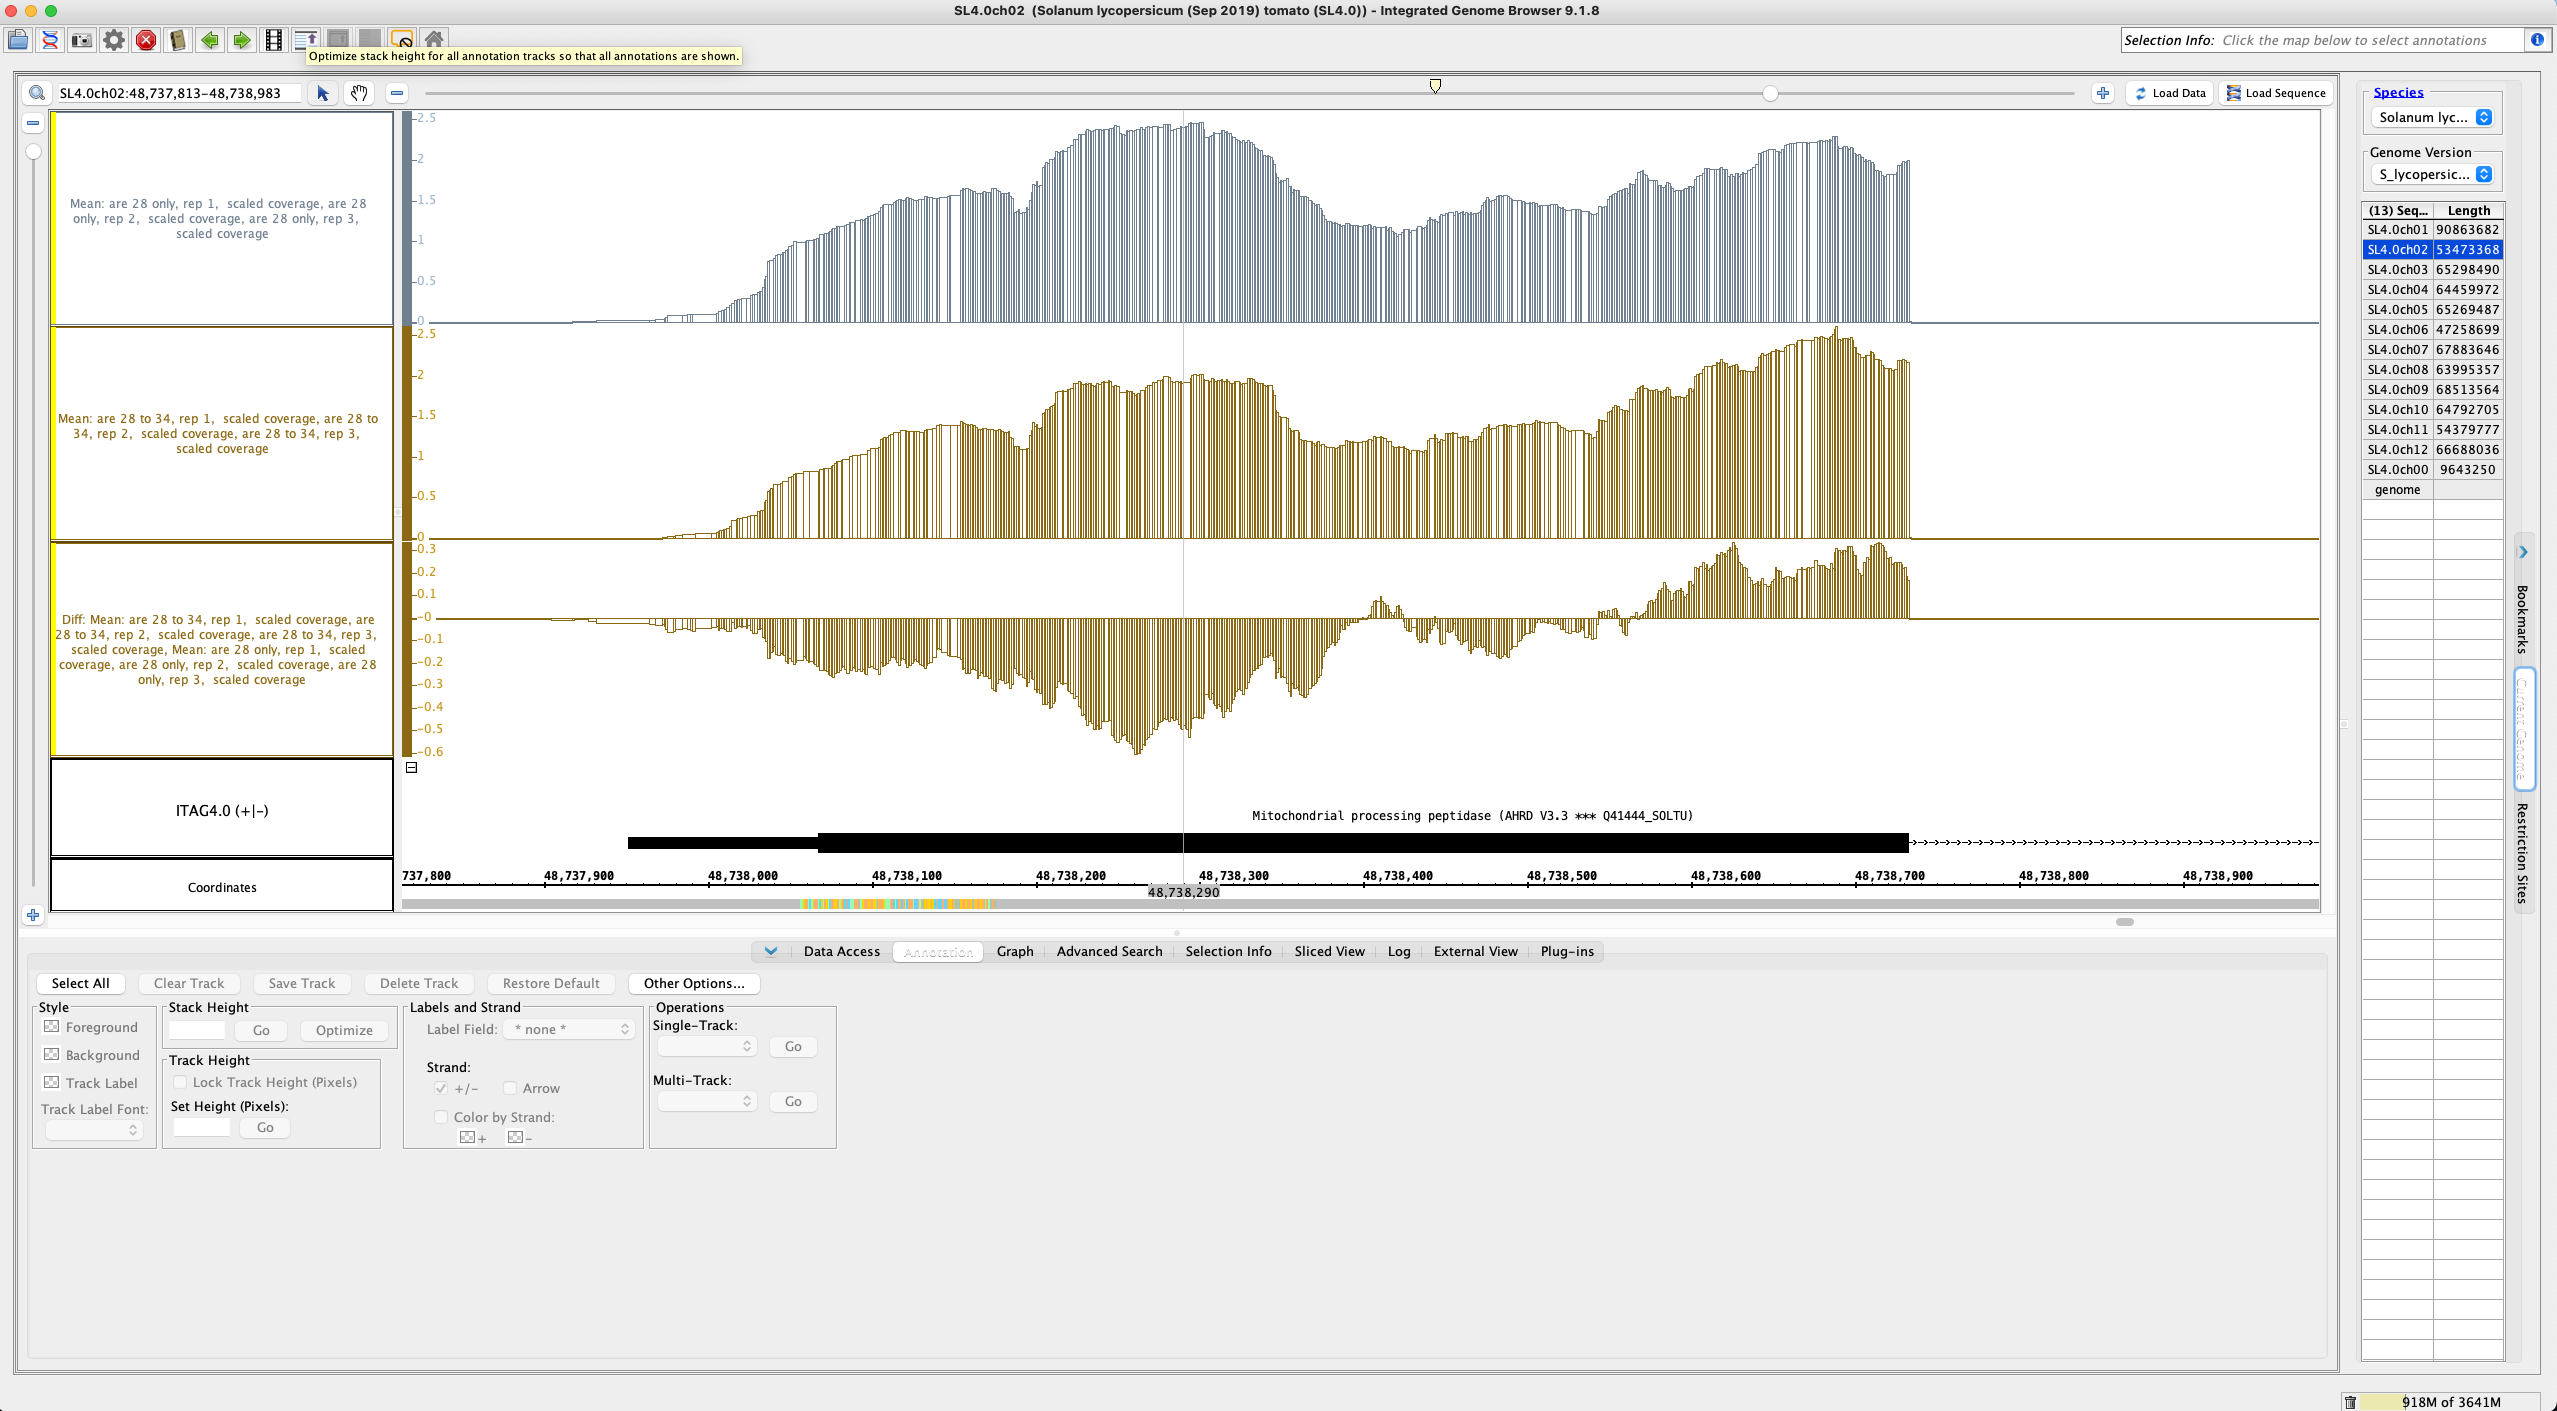
Navigate to SL4.0ch02:48,737,813-48,738,983
Click Load Data 3 times
This appears to break the Diff graph as it should now show incorrect data.
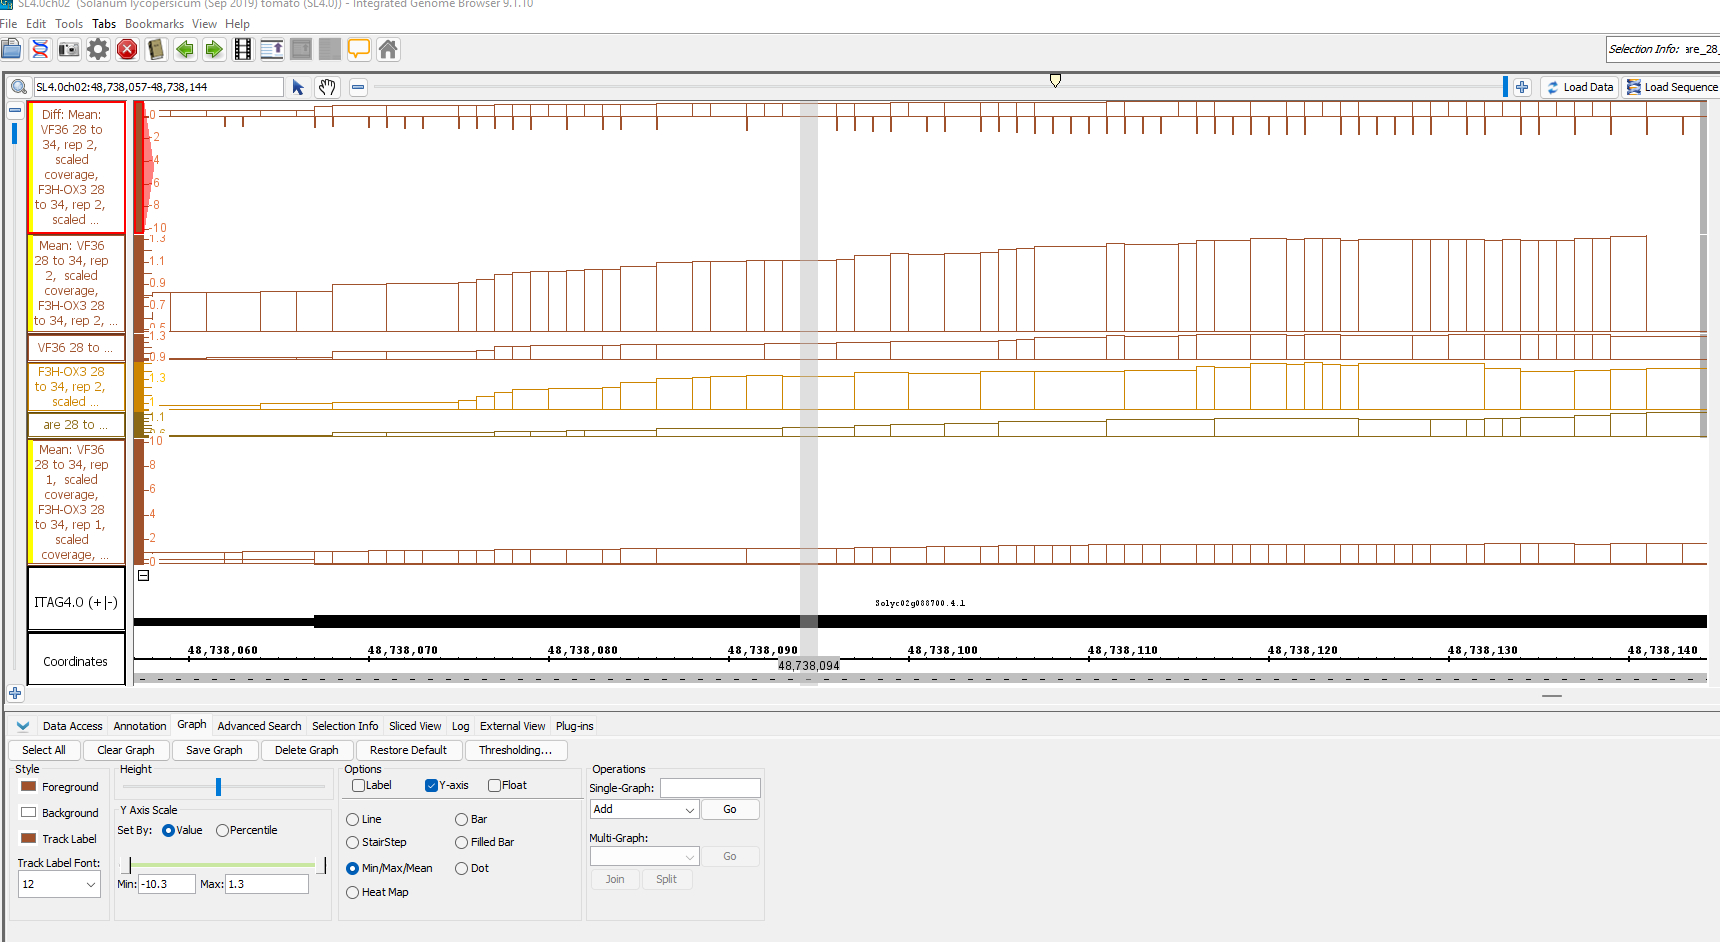
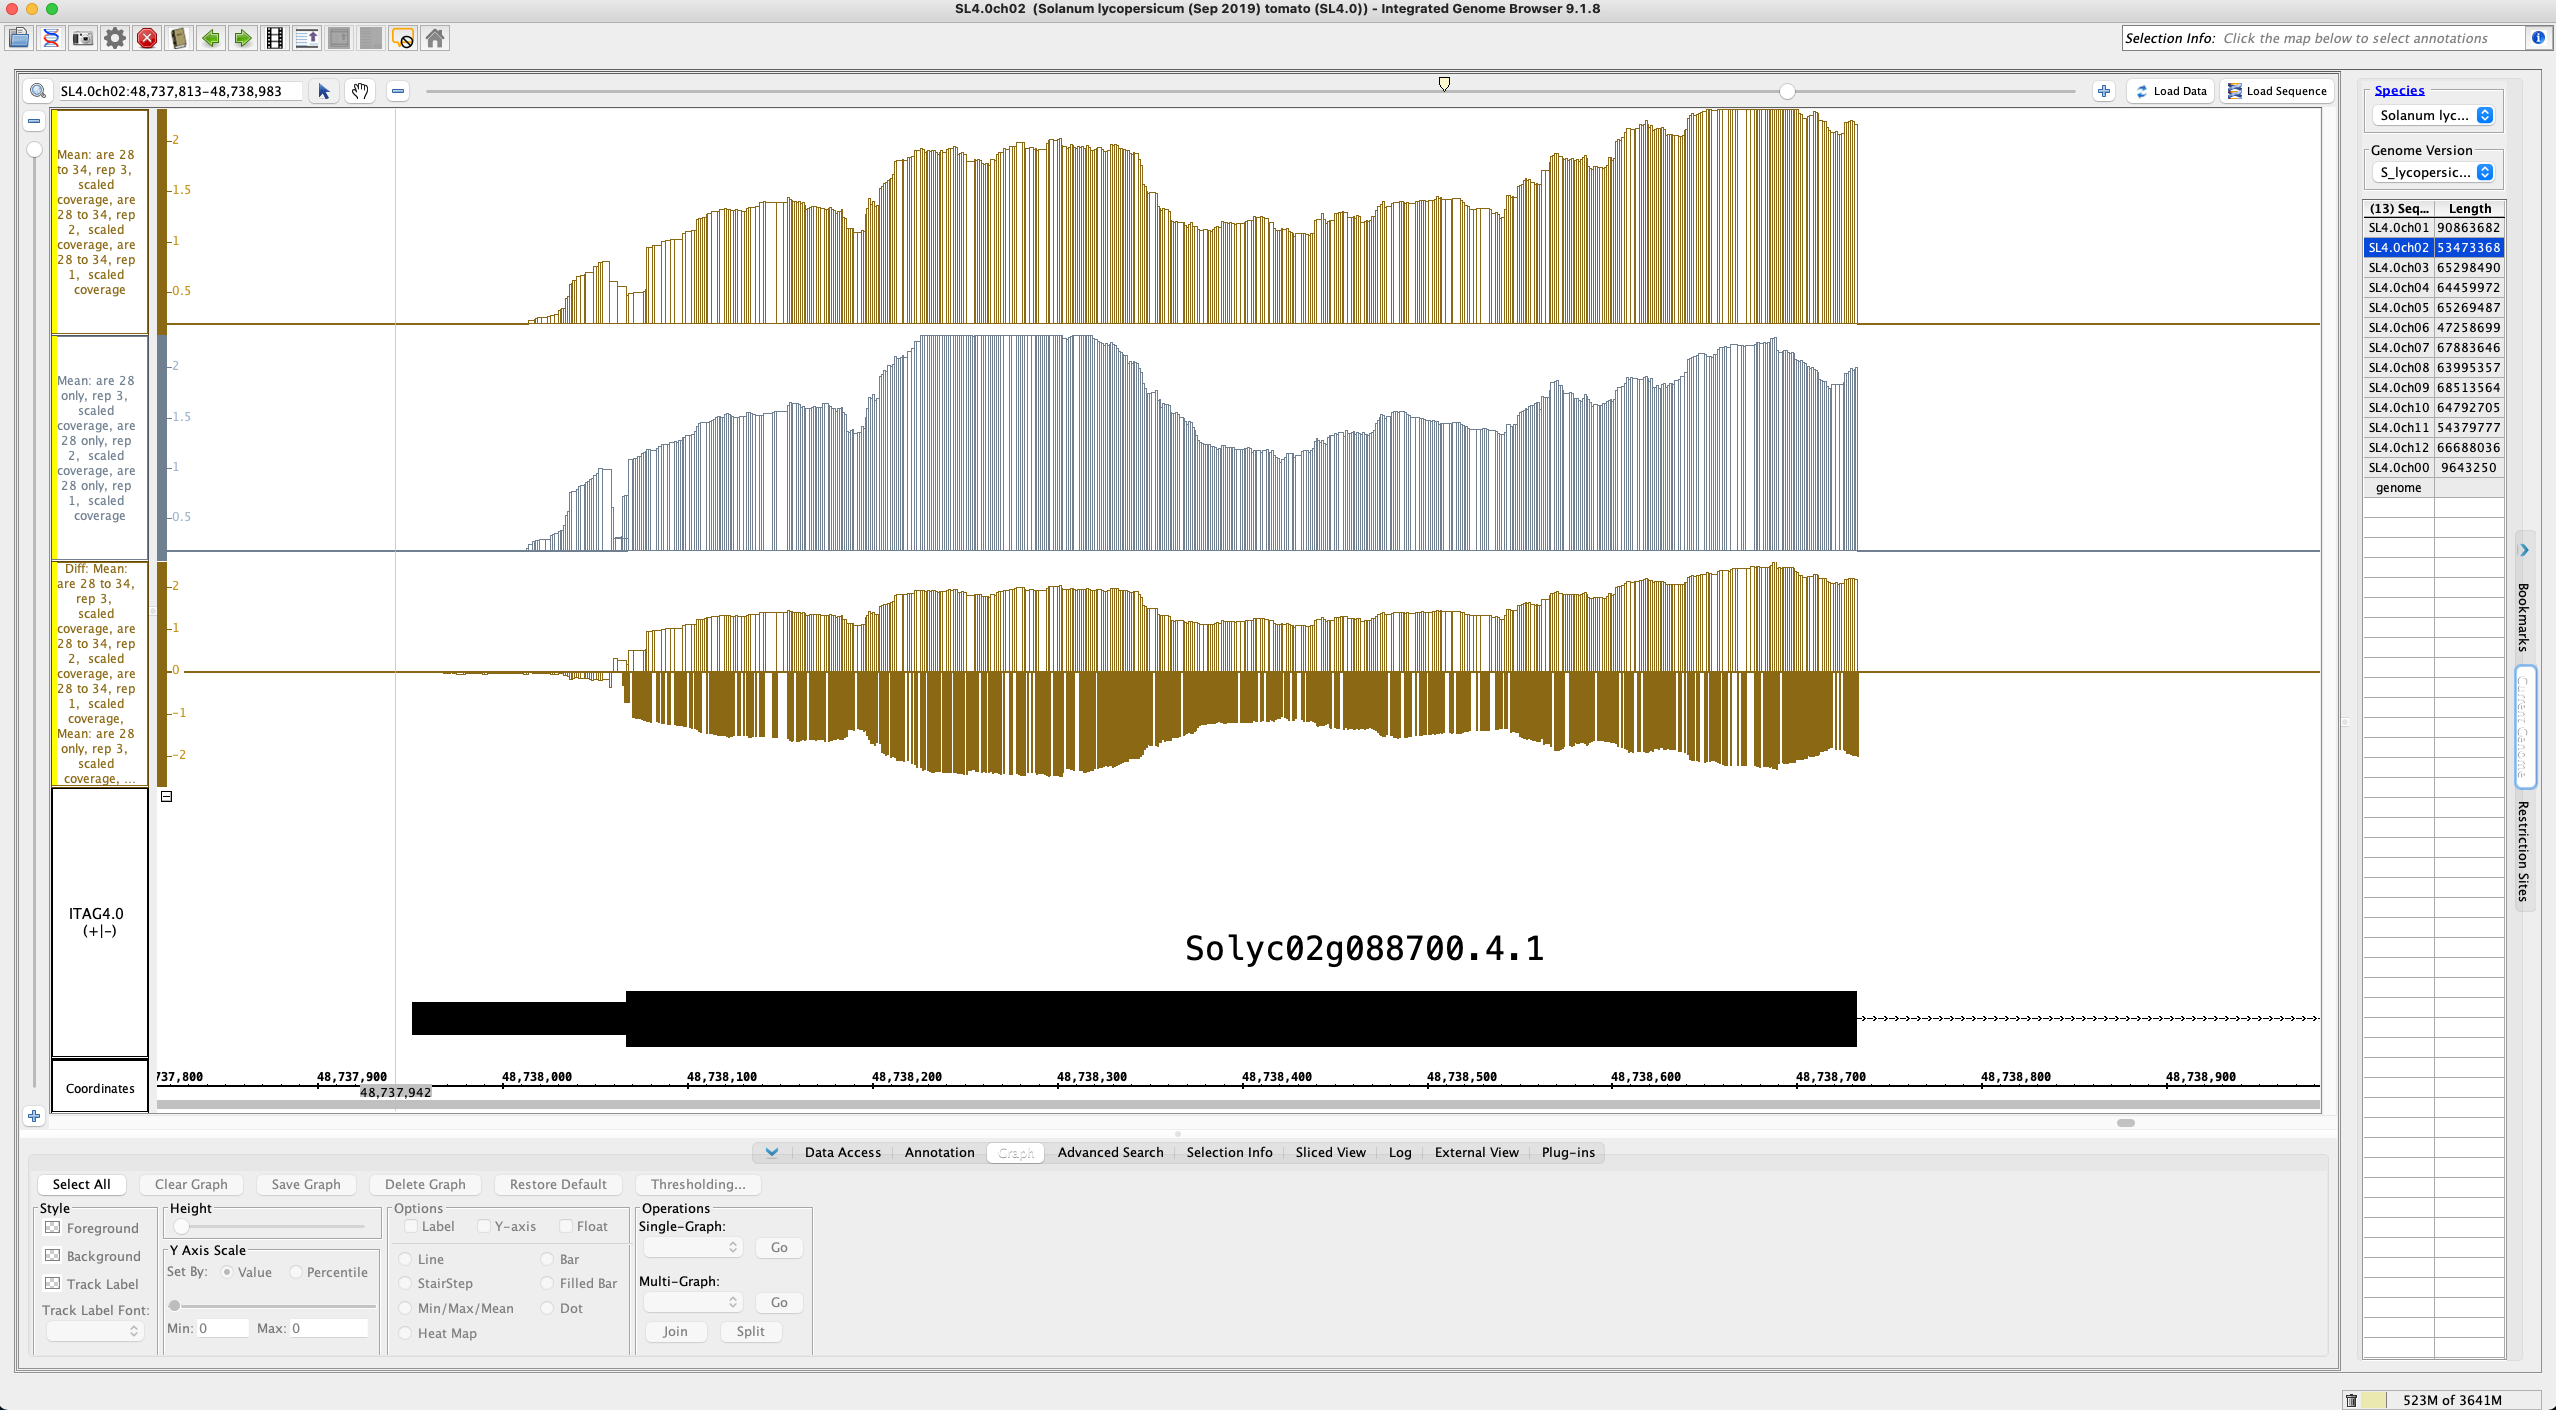
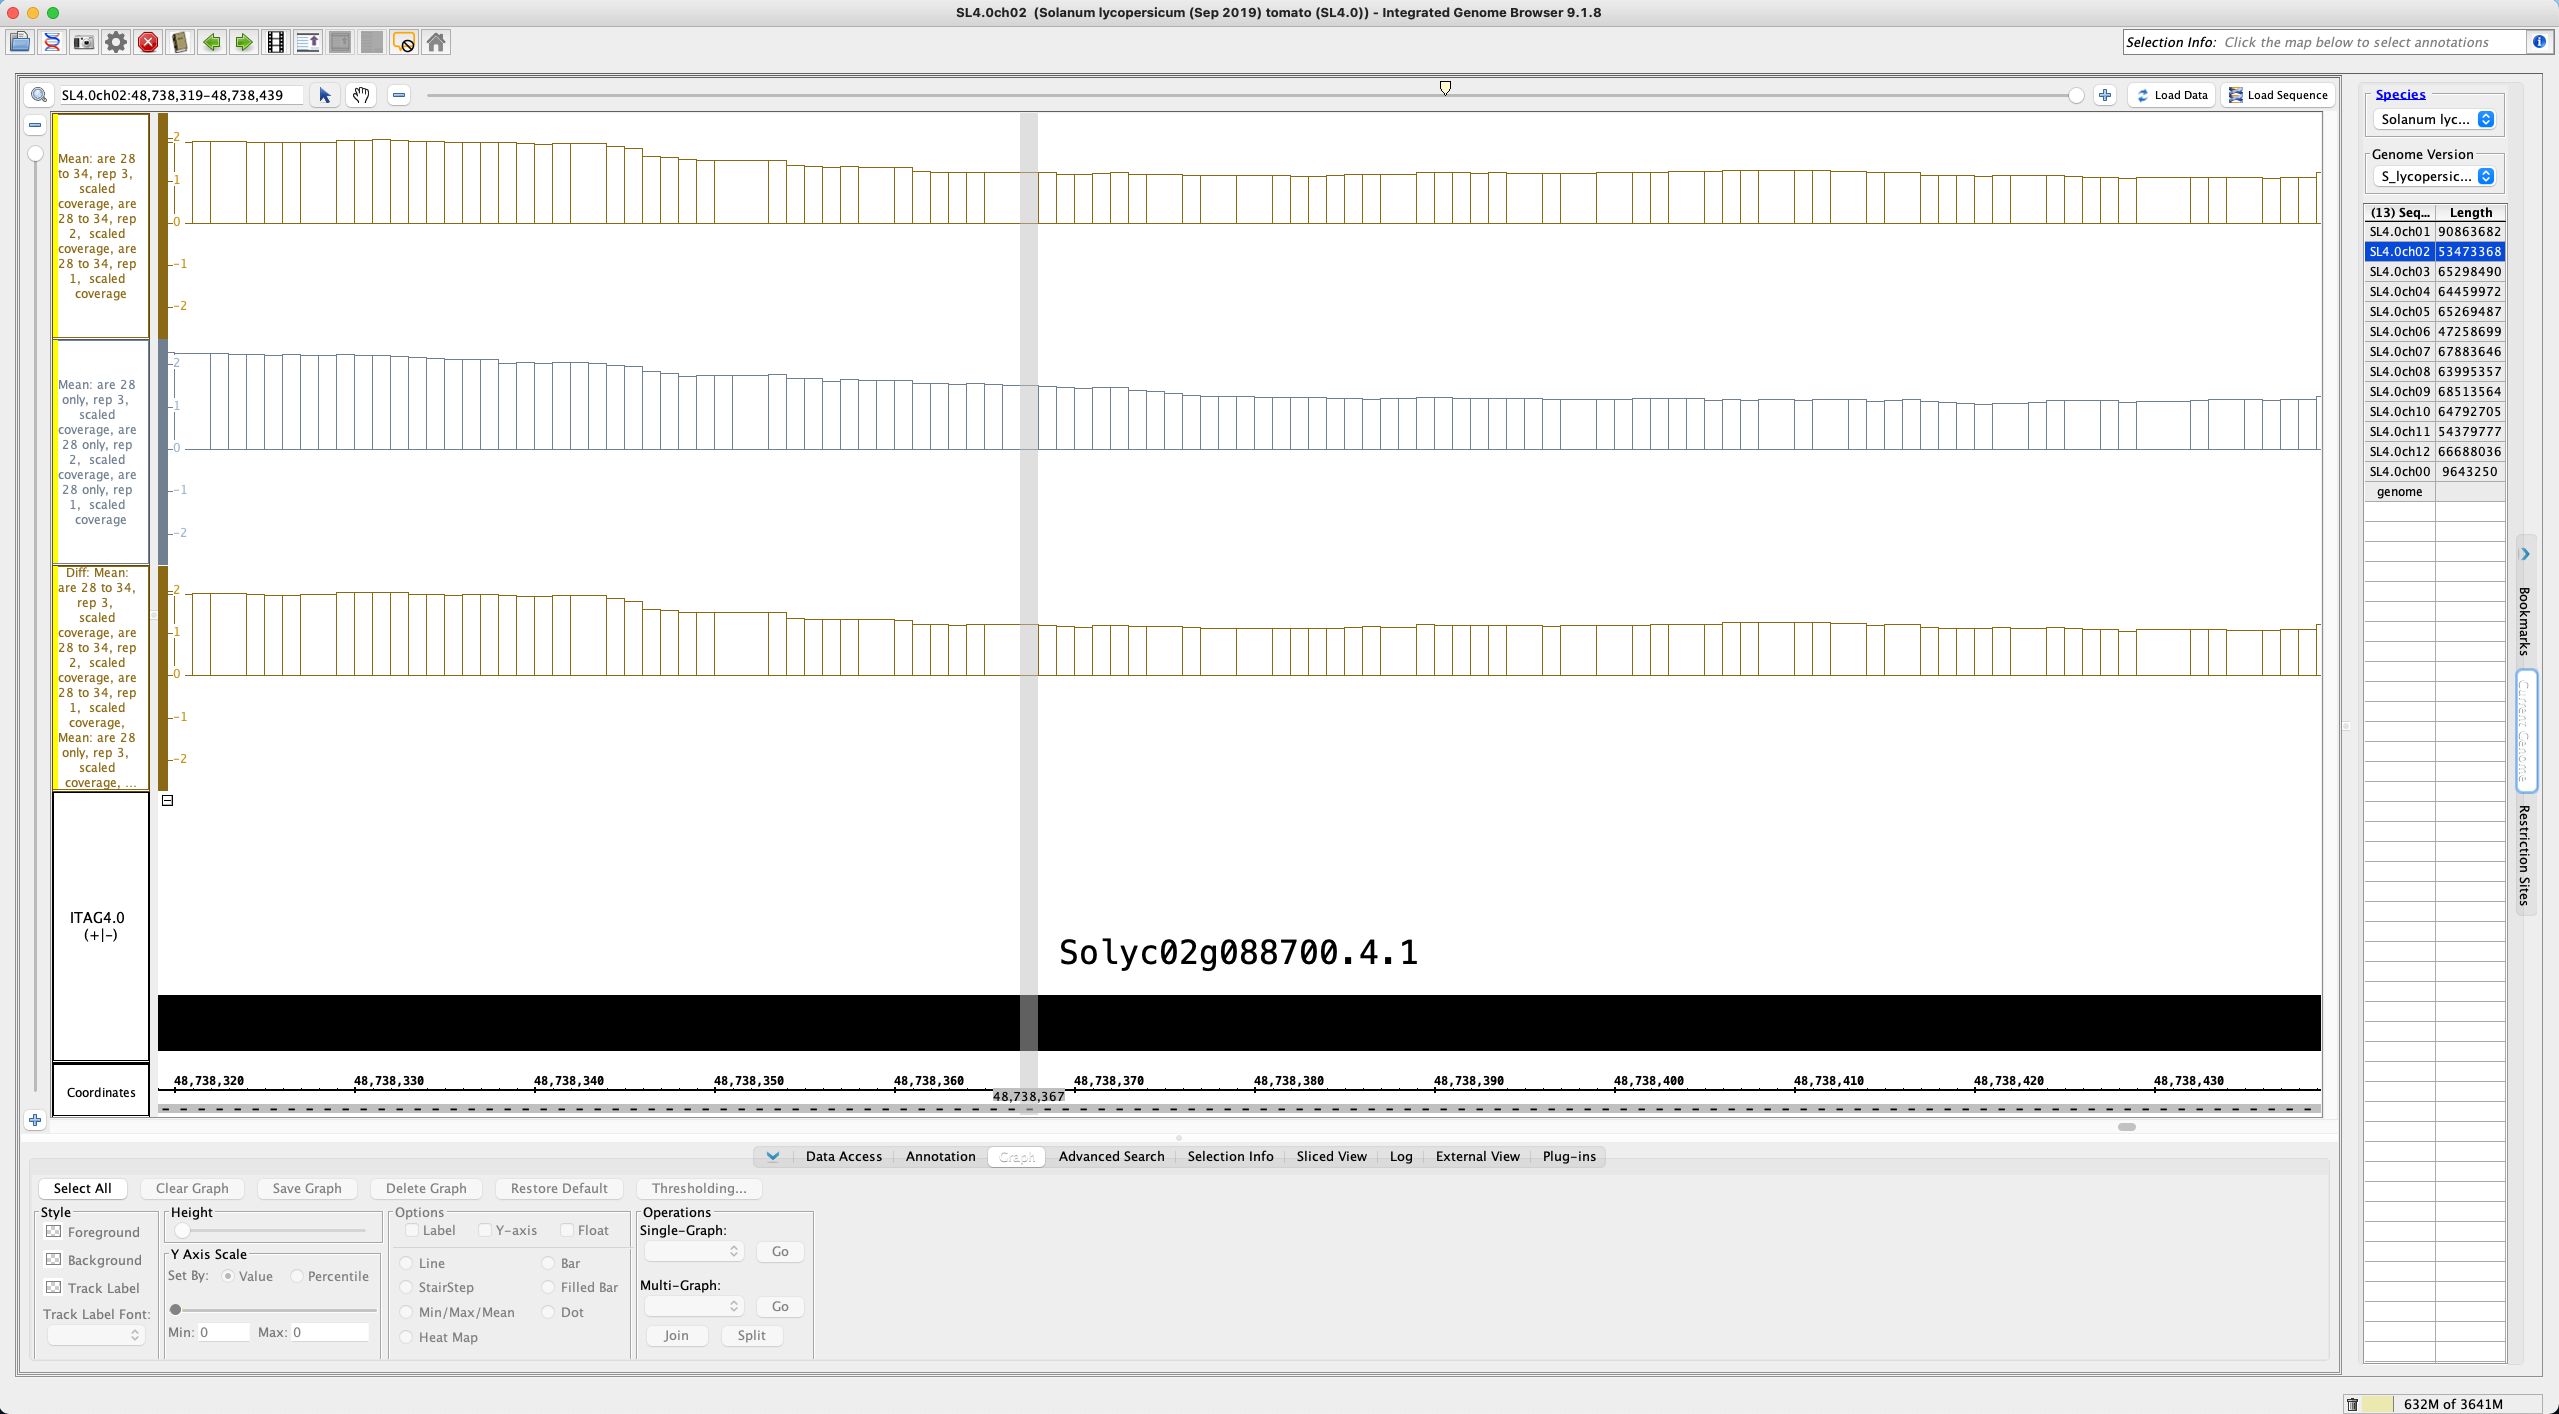
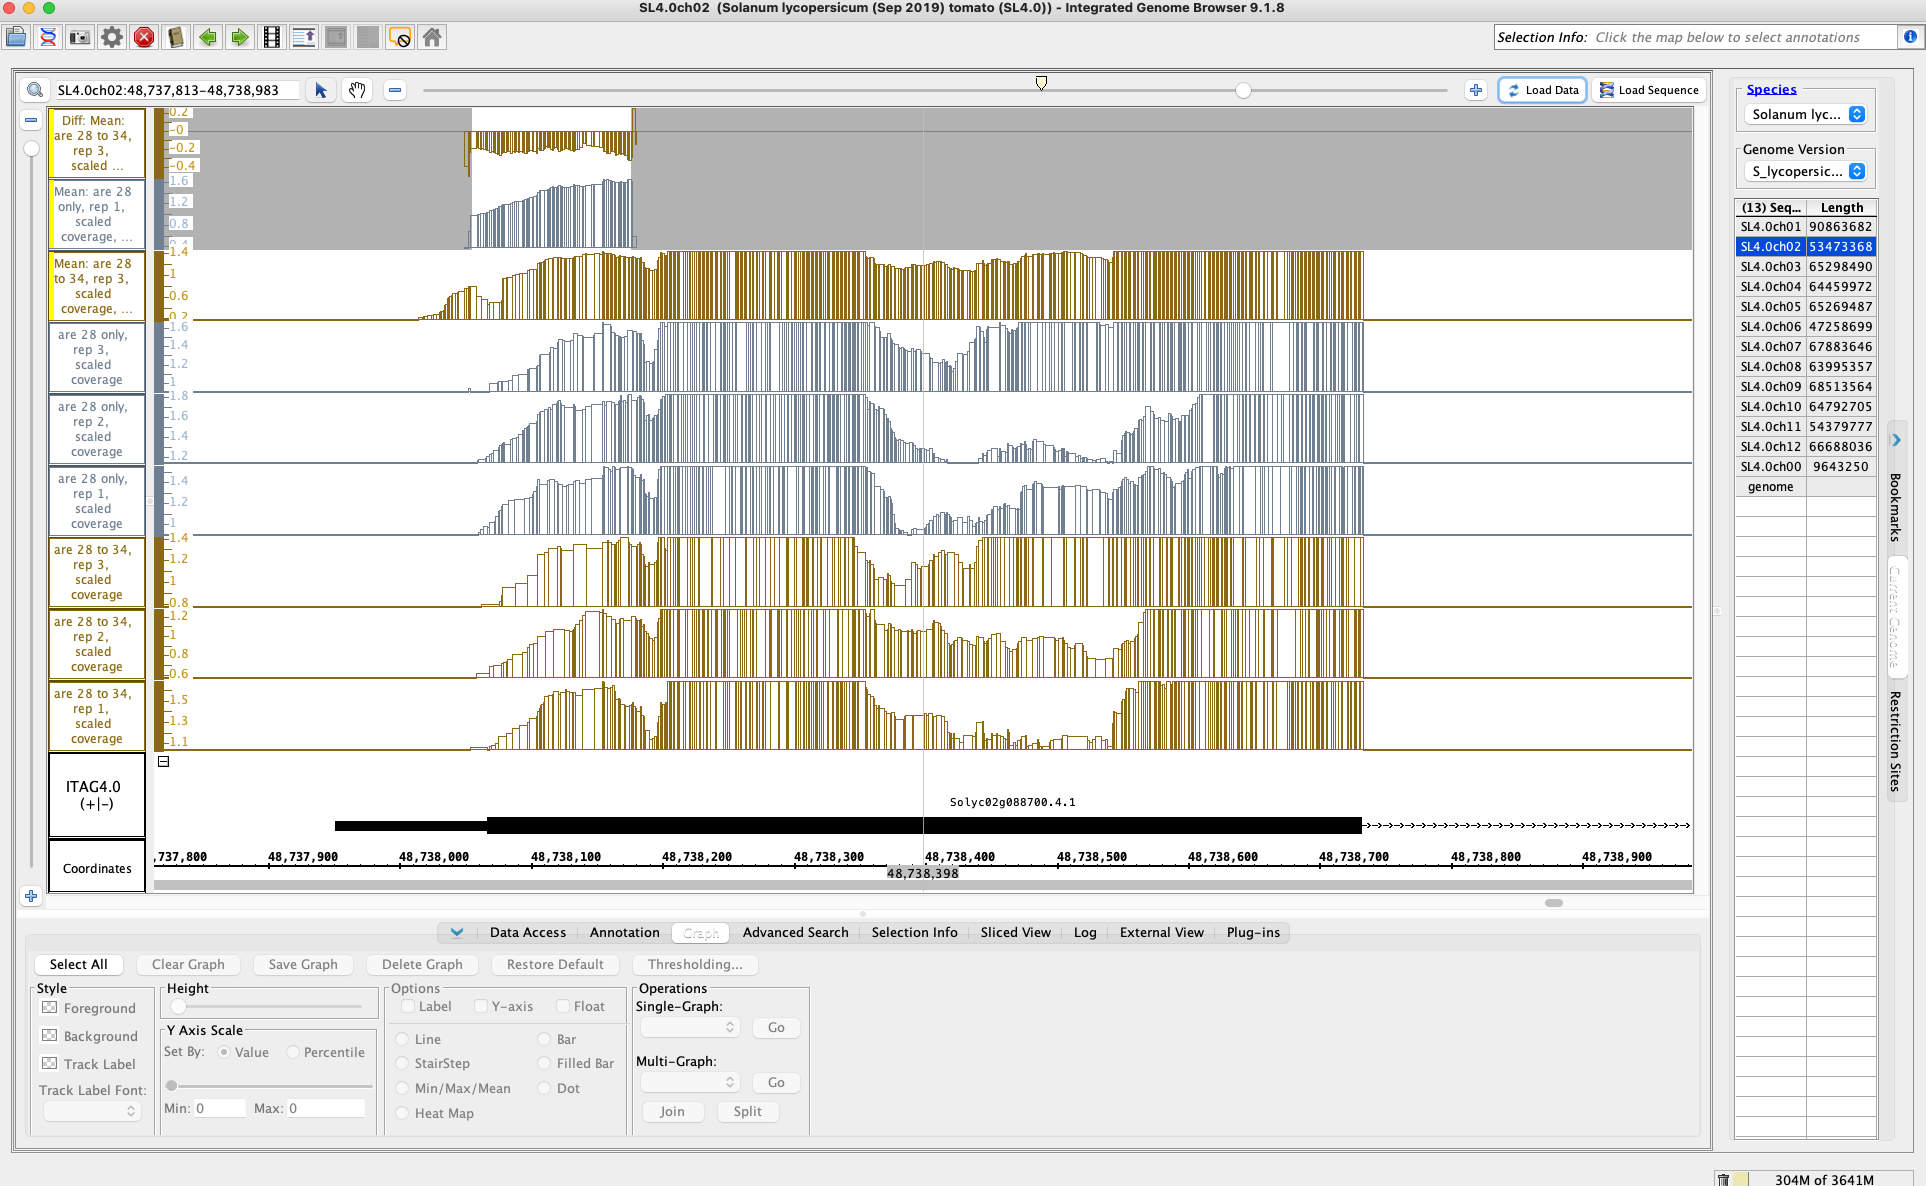
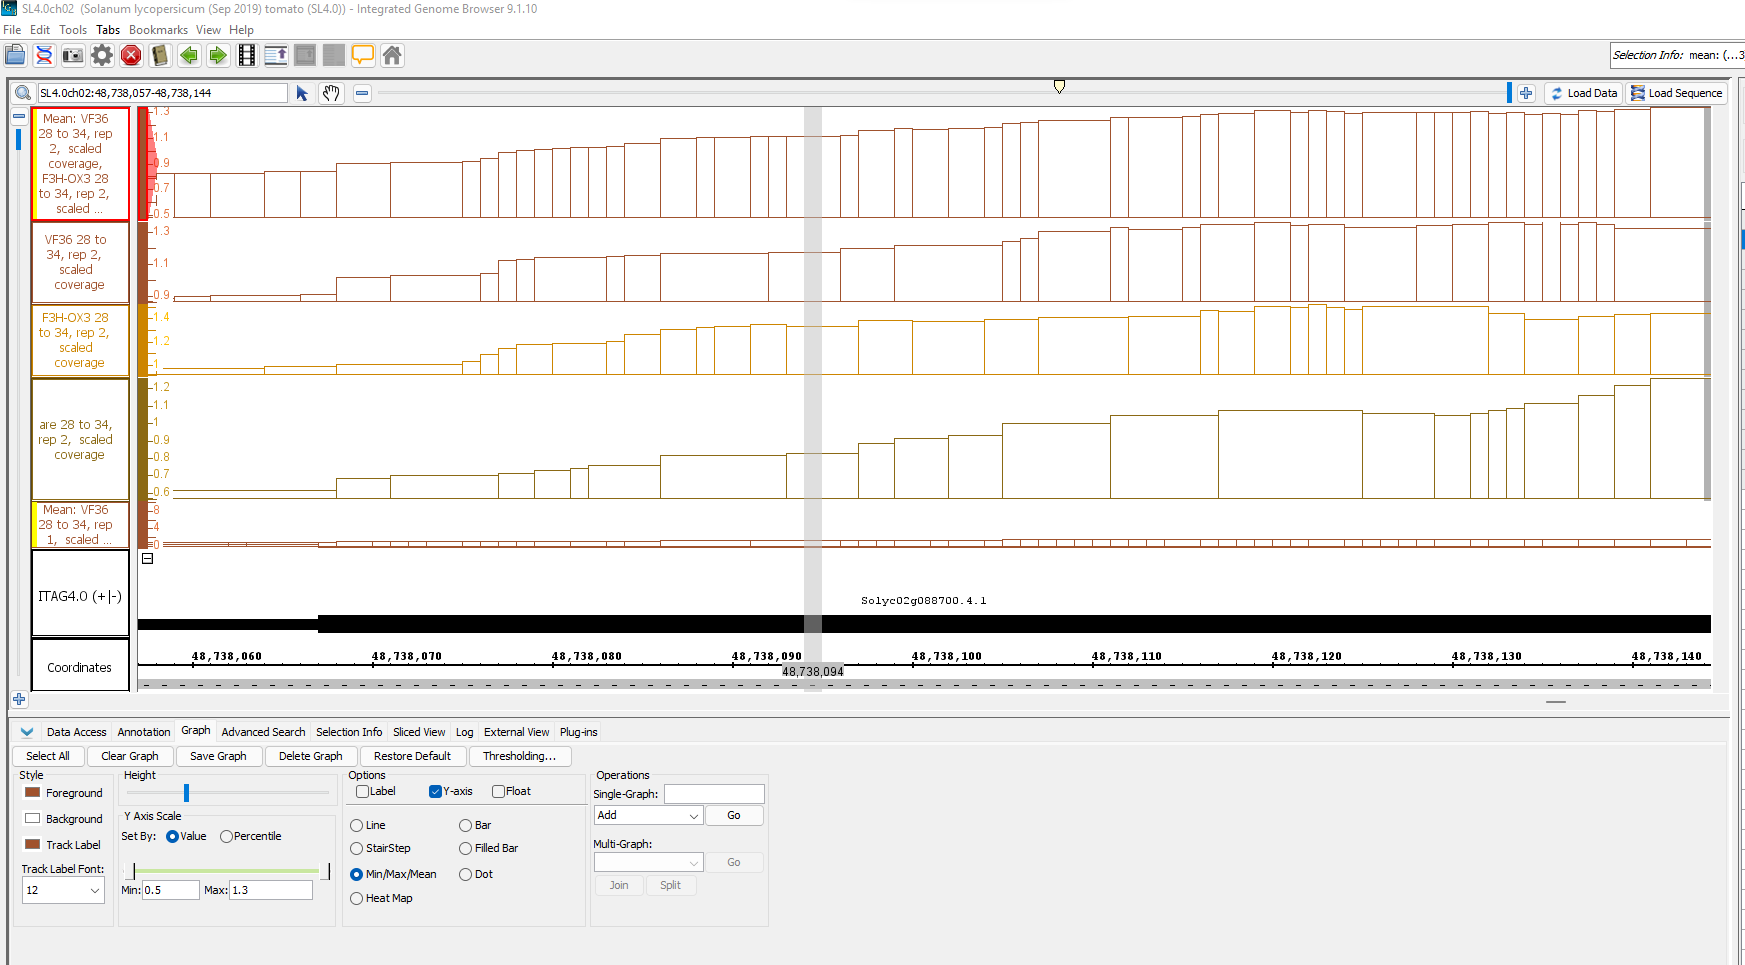
If all data including mean and diff graphs are loaded at SL4.0ch02:48,737,813-48,738,983 they appear correctly (see img1.png). It is only when the view is zoomed in initially, the data loaded, and then zoomed out that the diff graph appears to become corrupted (see img2.png). From examining the y-coord in the corrupted diff track, it appears that the data are a copy of the bronze colored mean track (see img3.png). IGB also appears to have trouble rendering the track, which is why it appears on both the positive and negative axis in img2.png.
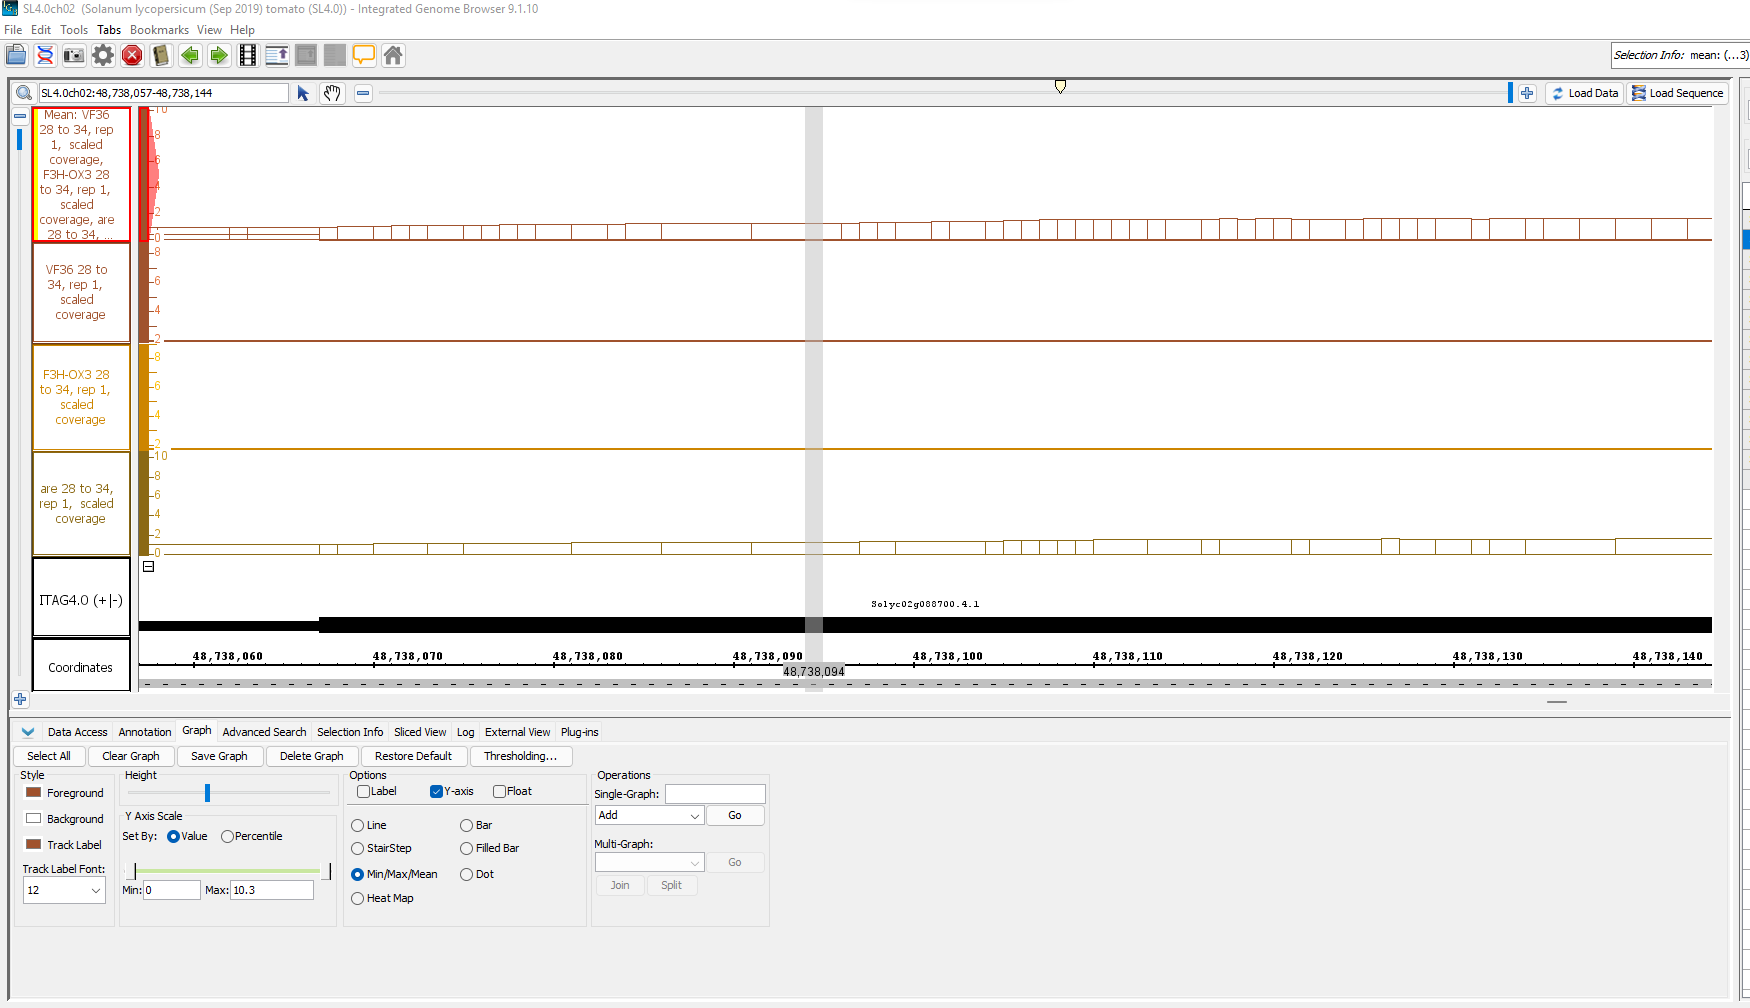
From this initial testing I can make a few guesses as to what might be happening. When IGB creates tracks based on multi-graph operators it first needs to load the data before calculating the multi-graph operator track. From the user's perspective they may need to click the Load Data button multiple times. In this example, there are two multi-graph operator tracks, so IGB needs to follow the correct order of operations to successfully create the diff of the means track. When I clicked load data it appeared that only one of the mean tracks was created successfully while the other was in limbo (see img4.png). Clicking load data again caused the corrupt diff track to appear.
In addition, once the corrupt diff track has appeared the track is broken from that point forward. Removing and reloading the track does not appear to fix the issue, only restarting IGB can correct the track. My guess would be that something is incorrectly being included in a data model for that track in IGB and is causing any attempt to further load data in the diff track to fail. However, nothing is appearing in the IGB logs.
While this is somewhat of an edge case I think it is worth further investigation as it could be very confusing for a user.
Tested on Mac 11.6.3 on IGB 9.1.8 release.
| Status | First Level Review in Progress [ 10301 ] | Needs 1st Level Review [ 10005 ] |
| Assignee | Nowlan Freese [ nfreese ] | Ann Loraine [ aloraine ] |
I think the next steps for this issue would be for someone to follow the steps outlined above to replicate the issue.
If the issue does appear to be repeatable, then I would suggest we create a new ticket to attempt to resolve the issue.
| Assignee | Ann Loraine [ aloraine ] |
| Status | Needs 1st Level Review [ 10005 ] | First Level Review in Progress [ 10301 ] |
| Status | First Level Review in Progress [ 10301 ] | To-Do [ 10305 ] |
| Status | To-Do [ 10305 ] | In Progress [ 3 ] |
| Status | In Progress [ 3 ] | Needs 1st Level Review [ 10005 ] |
| Status | Needs 1st Level Review [ 10005 ] | First Level Review in Progress [ 10301 ] |
Followed above testing instructions on IGB 9.1.10 with the build date/time : 01-24-2022 15:26:44 and the latest commit id : 6015d4c2488ec0abab95bd36b2ff1d94b3c3f9be and Operating System - Windows 11.
The issue does appear repeatable.
Dr. Freese is creating a new ticket to resolve the issue.
Thank you Omkar Marne and Nowlan Freese. Moving to Done, with the expectation that Nowlan Freese will create a new issue to address this.
I think it is indeed an important issue to address because there is now way for a user to understand the sequence of events that need to be performed in order to achieve the correct result. Also, this issue may have been noticed prior to this. It would be worthwhile to search Jira for prior observations of this same problem.
| Status | First Level Review in Progress [ 10301 ] | Ready for Pull Request [ 10304 ] |
| Status | Ready for Pull Request [ 10304 ] | Pull Request Submitted [ 10101 ] |
| Status | Pull Request Submitted [ 10101 ] | Reviewing Pull Request [ 10303 ] |
| Status | Reviewing Pull Request [ 10303 ] | Merged Needs Testing [ 10002 ] |
| Status | Merged Needs Testing [ 10002 ] | Post-merge Testing In Progress [ 10003 ] |
| Resolution | Done [ 10000 ] | |
| Status | Post-merge Testing In Progress [ 10003 ] | Closed [ 6 ] |
| Assignee | Omkar Marne [ omarne ] |
| Summary | Investigate graph addition problem | Replicate graph addition problem |
I have created IGBF-3084 to further investigate this issue.
I am not seeing evidence in the images of correct values. The view is too zoomed-out to investigate individual values at the individual base pair level.
For next step, we need to look more closely at image file scaledcoveragegraphs-ARE-chr1-diff-problem.png from the linked ticket
IGBF-3064.Please load the same scene and investigate. Do the y-axis values make sense? Check the "diff" graph track, which is supposed to be the subtraction of one computed mean track minus the other.